This is the fourth part of our 2018 review dedicated to the European public biotech landscape. Check out Part 1, Part 2 or Part 3.
The full report is now available here.
Part 4 - Table of Content
5. Financing
6. Other financial metrics: cash burn, extra cash sources, cash balance, profits & losses
6.1 Cash burn
6.2 Extra sources of cash
6.3 Balance between cash raised and burnt
6.4 Profits & Losses
5. Financing
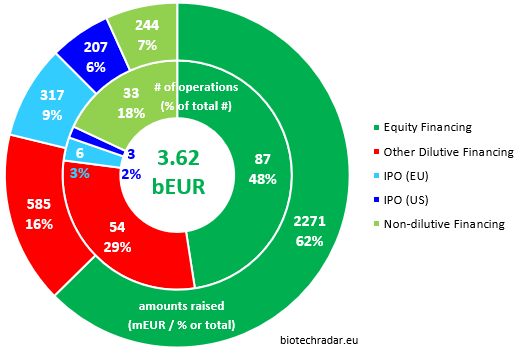
The 150 European public biotech companies in our selection have raised approximately 3.62 bEUR in 2018, in around 187 operations relating to the financing categories we consider (see Figure 34 for the amounts raised & number of operations by financing category). It has to be compared to approximately 4.25 bEUR in 2017 (-15% year-over-year), with 178 operations in 2017, according to our preliminary numbers (small variations upwards may be expected for 2017).
Nota Bene: even if some financing schemes are drawn down over time, we count them as fully committed at the signing date in the “amounts raised”, as these figures measure the ability of the companies to find investors or creditors. On the other hand, only actually drawn/booked amounts are considered in the part dedicated to the cash burn figures in section 6.
Overall, 2 thirds of the financing amounts came from “offering”-like financing in 2018, for almost 2.3 bEUR (approximately +37%/+600 mEUR versus 2017) and 87 operations (stable number compared to 2017), or about half of the funding operations (48%). The median amount raised in this category was 8.9 mEUR (IQR = [3.7; 22.0] mEUR), as compared to 7.0 mEUR in 2017 (IQR = [2.6; 19.0] mEUR). This was a solid performance, offsetting the poor one on the IPO side. As per the 2019 BIO Industry Report [16], 17.5 bUSD (or approximately 14.8 bEUR) were raised in the US from “Follow-On Public Offerings” for “Emerging Therapeutic Companies” in 2018, which is approximately 6.5-fold more than for our European universe.
Moving to the IPOs, 2018 was much weaker than previous ones in Europe, as we already mentioned. The US IPOs usually allow some European biotech companies already listed in Europe to raise cash amounts in ranges that are not possible in their home markets. However, in 2018, only Morphosys (Germany) managed to raise a significant amount, that was 193 mEUR (239 mUSD).
Biofrontera (Germany) and Tiziana (UK) also managed to dual-list on Nasdaq during 2018, but with much smaller operations (10 and 4 mEUR raised, respectively, amounts that are common in Europe). Overall, the decline in amounts from US IPOs (dual listings) was 72% (-460 mEUR). European IPOs only led to 317 mEUR of cash injections. Here again, the decline in amounts from European IPOs (our universe) compared to 2017 reached 67% (-640 mEUR). Still as per [16], 4.4 bEUR (5.2 bUSD at 1.1815 EUR/USD average FX rate in 2018) were raised in 2018 on the US markets in 49 IPO operations (including the dual-listings from European companies), so a tremendous gap between the 2 continents.
Dilutive financings regrouping any kind of convertibles, equity lines and exercise of warrants/options and helped raising 585 mEUR, but with more than 50 operations (negligible amounts from the exercise of warrants/options missing). This amount is driven for almost 60% by 2 large Convertible Bonds programs for Idorsia (Switzerland) and Cosmo (Italy). More interestingly, in 2018, 15 operations of Convertible Loans/Bonds and Equity Lines (program amounts <30mEUR) gathered 85.6 mEUR, with an average amount of 5.6 mEUR and a median of 3.4 mEUR (compared to 2017: 10 such operations for a total of 97.6 mEUR, 9.8 mEUR average, 10.0 mEUR median). This partly reflects the increasingly challenging conditions for financing in 2018, at least for some of the smallest caps. More of these small caps (still a minority) made use of these categories of financing, but for smaller amounts. The problem is that most of these equity lines and other convertible schemes have become the main or only sources of funding for many of these small companies, instead of being just addons to share issues. As raising equity from institutional shareholders is very difficult or impossible for them, these companies subscribe to financing schemes that actually keep them alive, but most of the time at the expense of a long declining journey for the stock price…
Finally, one fifth of the financing operations were non-dilutive, but only led to 6% of the financing amounts, or 244 mEUR (down 43% versus 2017, but this amount was impacted by a 140 mEUR bridge loan to Evotec for the acquisition of Aptuit). We will also mention the contribution of the European Investment Bank (EIB), offering several vehicles to support the growth of the biotech companies, usually to support them on their final steps towards commercialization. In 2018, the loan agreements signed between the EIB and the European listed biotech companies, and the grants awarded (mainly in the frame of the Horizon 2020 program) reached 132.3 mEUR with 6 operations, a net progress from 2017 (77.4 mEUR but only 2 operations, and including a loan for Evotec of 75 mEUR).
The most important financing operations of 2018 per category can be found on Table 9. They represent almost 60% of all the amounts raised/committed last year.
| Date | Company | Amount (mEUR) | Comment |
| Equity Financing | |||
| Q3'18 | Galapagos (BE) | 297 | US Offering |
| Q3'18 | Idorsia (CH) | 262.5 | EU Offering |
| Q3'18 | argenx (BE) | 255.8 | Combined EU & US Offering |
| Q2'18 | Cellectis (FR) | 142.6 | US Offering |
| Q1'18 | DBV Technologies (FR) | 140.8 | Combined EU & US Offering |
| Other Dilutive Financing | |||
| Q4'18 | Cosmo Pharma (IT) | 175 | Convertible Bonds (Unsecured) |
| Q3'18 | Idorsia (CH) | 172 | Convertible Bonds (Unsecured) |
| IPO (EU) | |||
| Q2'18 | Polyphor (CH) | 139.2 | IPO on SIX Zurich (CH) |
| Q3'18 | Calliditas Ther. (SE) | 71.6 | IPO on Nasdaq OMX Stockholm (SE) |
| Q1'18 | Acacia Pharma (UK) | 40 | IPO on Euronext Brussels (BE) |
| Q4'18 | MedinCell (FR) | 31.4 | IPO on Euronext Paris (FR) |
| Q4'18 | Alzecure Pharma (SE) | 19.4 | IPO on Nasdaq OMX Stockholm (SE) |
| Q3'18 | Asarina Pharma (SE) | 15.6 | IPO on Nasdaq OMX Stockholm (SE) |
| IPO (US) | |||
| Q2'18 | Morphosys (DE) | 193.1 | Nasdaq IPO |
| Q1'18 | Biofrontera (DE) | 10.4 | Nasdaq IPO |
| Q4'18 | Tiziana Life Sci. (UK) | 3.9 | Nasdaq IPO |
| Non-dilutive Financing | |||
| Q3'18 | Nanobiotix (FR) | 40 | EIB Loan |
| Q4'18 | Newron Pharma. (IT) | 40 | EIB Loan |
| Q3'18 | Bavarian Nordic (DK) | 30 | EIB Loan |
| Q3'18 | Acacia Pharma (UK) | 25.8 | Credit Facility |
| Q1'18 | MedinCell (FR) | 20 | EIB Loan |
| Q2'18 | Pharnext (FR) | 20 | Bond Loan |
The breakdown of the amounts raised in 2018, by country/cluster and by stock market operator, is shown on Figure 35.
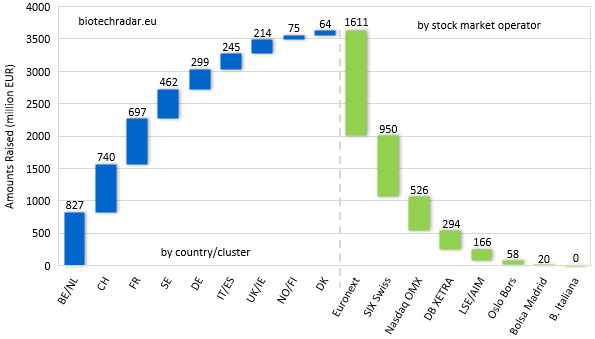
The top 3 countries/clusters (Belgium/Netherland, Switzerland and France) gathered 62% of the total amounts, with amounts ranging from 697 to 827 mEUR. With a significant drop with respect to France, Sweden managed to raise 462 mEUR. Then the amounts fall again quite significantly for Germany, Italy/Spain, UK/Ireland, all in the 200-300 mEUR range. Finally, the smallest cluster Norway/Finland raised 75 mEUR, while Danish listed biotech companies had only raised 64 mEUR.
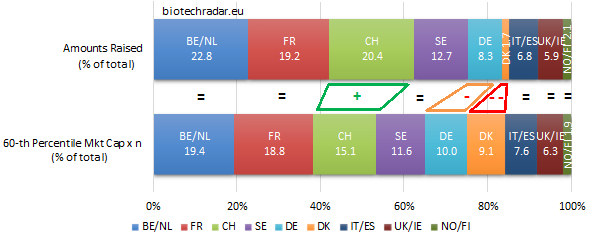
To support the interpretation of the “performance” with respect to the amounts raised in each country/cluster, we added the Figure 36, which introduces a comparison with a reference. This reference can be viewed as a simple model, reflecting the amounts of financing needed for a pool of “n” companies, only using a given percentile of the distribution of the market cap and a fit -constant- parameter (see Annex 1 of downloadable review for explanations).
When compared to the simple model estimates (60th-percentile market cap, times number of companies, divided by a constant ratio) on Figure 36, the main deviation arises from Denmark, which can be explained by the small number of companies and the fact that they were almost all funded well over the end of 2018, except Oncology Venture, a small cap biotech (European referential!). On the other side, Switzerland raised more money than the model estimate. This can be mainly be explained by Idorsia, who managed to raise more than 430 mEUR in 2018. Polyphor’s successful IPO in Zurich also generated an inflow of almost 140 mEUR for the company. Germany is also slightly short compared to the model estimate.