
This is the second part of our 2018 review dedicated to the European public biotech landscape. Check out the introduction and first part here.
The full report is now available here.
Part 2 - Table of Content
2. R&D Pipeline & Commercial Products
2.1 Unique product candidates in active clinical development, indications and therapeutic areas
2.2 Product candidates in registration and commercial products
2.3 Assessing the full pipeline breadth: R&D programs in active clinical development
References
2. R&D Pipeline & Commercial Products
2.1 Unique product candidates in active clinical development, indications and therapeutic areas
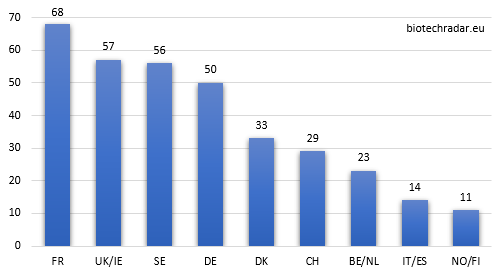
The number of unique product candidates in active clinical development is represented in Figure 9, for each country/cluster. These assets are considered to be in active clinical development if they have at least started a phase 1, and if the companies have not declared their development as set on hold/paused/delayed. An asset waiting to be partnered to be developed at a further stage (usually after proof-of-concept) is still considered as active here, although such an event might never occur. However, we set the status on hold anyways if there is no news for a long period. The product candidates having entirely completed their pivotal clinical program and under review for registration are not taken into account here (see dedicated section 2.2). Product candidates already approved are not included either, even if their development is pursued in another approved indication (see also section 2.2).
The unicity of the candidates is defined with the removal of duplicates from the following categories: indications, territories, targeted populations, formulations. These clinical assets may be developed by the companies alone or with one or several partners, potentially in-licensed and not yet at the registration stage/approved/marketed (even if developed in several indications). The only duplicate cases are when 2 companies in our universe share an asset: in this case, it is counted once for each company, but consolidated again at the country/cluster level if the 2 companies are in the same country/cluster. With our set of criteria, there were 341 unique product candidates in active clinical development among the European biotech companies in our universe, at the end of 2018 (336 if the assets with shared ownerships among companies in our universe are counted only once).
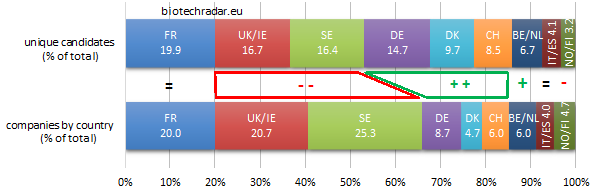
Without surprise, the 3 main clusters (France, UK/Ireland and Sweden) are the top 3 contributors. However, as shown on Figure 10, UK/Ireland and Sweden globally under-contribute in quantity, as they both have the most important proportion of companies at the preclinical stage (see also Figure 8). On the contrary, Germany (thanks to Morphosys and Evotec), Denmark (Genmab), Switzerland (Idorsia) contribute over or well over their respective ratios.
When looking at the absolute numbers by stage and by country (Figure 11), and focusing on the late-stage assets, France is where the highest number of active R&D assets are in late-stage development, particularly in phase 3 (on-going, or completed but not yet filed for registration). The other 2 important clusters complete the podium: the numbers at each stage for UK/Ireland and Sweden are close, with a short edge for the UK in late-stage. Switzerland is also well ranked for the late-stage assets thanks to Idorsia (4 unique assets in phase 3 for this company alone). 57 unique assets were in phase 3 at the end of 2018.
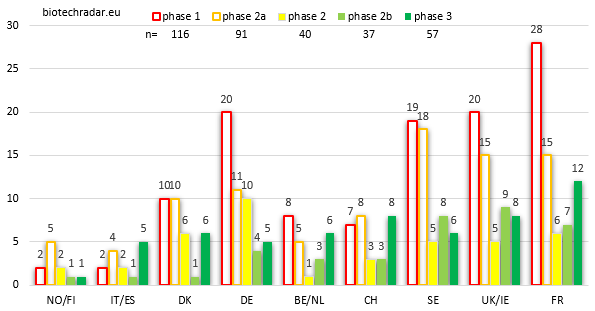
Germany has an abnormal number of unique product candidates at the phase 1 stage. This is due to 2 companies, Morphosys and Evotec, which are 2 of the most important R&D powerhouses (mainly in the frame of partnered programs) in our European biotech universe, if not the 2 most important ones. Morphosys has built an important partnered pipeline over the past 2 decades, and the business model of Evotec is to deliver phase 1-ready candidates for their customers, so in fact, no real surprise here. Still on early-stage assets, Sweden and the UK have a similar number of product candidates both at the phase 1 and phase 2a/PoC stages. However, as seen on Figure 8, Sweden has relatively more phase 1-stage companies than the UK. This illustrates the fact that in Sweden, the phase 1 assets are more lead assets whereas in the UK, they are almost only follow-on assets within broader and/or more advanced pipelines.
Germany also has the highest number of mid-stage phase 2 assets, owing this position to a high number of oncology assets at this stage, from 4SC AG and Morphosys.
Of note, France is ranked in the TOP 3 at each development stage, without any special outlier. Knowing that more than 70% of the French biotech companies reached either the commercial stage or a late stage (Figure 8), this means that the 60% of early stage assets (Figure 12) are usually follow-on R&D projects as well, complementing at least one other later-stage asset. We may do one remark concerning the lack of outliers among the French biotech landscape. This is interesting on one hand because the potential is globally evenly spread over the landscape. But on the other hands, outliers are signs of success(es). So far, the French sector is still looking after THE company with a blockbuster in the pipeline, able to address a large population, and likely assisted by a Top 10 Big Pharma on its way to vertical integration: in other words, a good success story. In contrast, Belgium/Netherlands do not look particularly strong on Figure 11, but at least 2 of the late-stage assets are already worth billions (filgotinib and efgartigimod, 2 assets with a “pipeline-in-a-product” profile, with an option as well for cusatuzumab, and others if approved). At the end of 2018, in terms of market cap, Galapagos alone was worth more than the 30 French biotech companies in our universe listed in Paris…
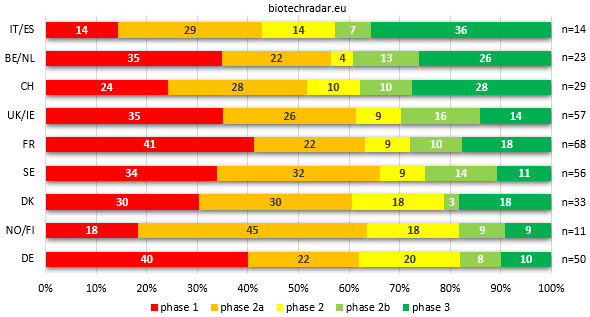
The distribution of the unique assets in active development broken down by clinical stage is represented on Figure 12 for each country/cluster. While the picture in the Top 3 is almost the same versus the distributions of companies ranked by most advanced development stage from Figure 8, the rest of the ranking is entirely reshuffled. Italy/Spain indeed takes the first place to Belgium/Netherlands but the proportion in the Top 3 is very close, all around 40%, with a 10% gap on the fourth place. The main differences concern the UK/Ireland (+3) and Germany (-3). For the UK, the fact that we removed the preclinical assets -and thus the 6 preclinical companies- make the contribution of the clinical-stage companies look much better (the same reason applies for Sweden, +2 in the ranking). For Germany, the explanation was mentioned above: the contributions in early-stage assets of Evotec and Morphosys dilute the later-stage part. The same dilution operates for Denmark, where Genmab and Saniona contributions at the Proof-of-Concept stage make the national sector move down by 2 places.
Overall, all these R&D assets were addressing 271 unique indications at the end of 2018, with many assets addressing several of them.
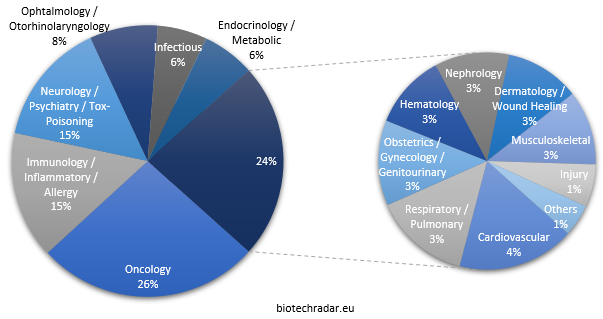
Like everywhere else in the world [16-17], oncology, just reported as having taken over from cardiovascular diseases for the leading cause of death worldwide [18], is the most pursued area, with roughly one fourth of all the indications (Figure 13). Two areas come next, with 15%: immunology/inflammatory diseases/allergy (including autoimmune diseases) and neurology/psychiatry to which we attach toxicity management/rescue, as well as addiction and anesthesia/sedation. These 3 areas include slightly more than half of the indications (56%). Another small quarter is composed of ophthalmology/otorhinolaryngology, infectious diseases and endocrine/metabolic diseases, each between 6 and 8%. The last quarter is very fragmented, with 9 areas between 1 and 4%. Of note, infectious diseases, a huge unmet need worldwide because of the antimicrobial resistance concerns, gather 6% of the indications, especially in the UK and Switzerland. In contrast, only 4% of the candidates in active development address cardiovascular diseases, the formerly leading cause of deaths in the world until 2017 [18].
Rare diseases (as listed on rarediseases.org and orpha.net, with a prevalence cut-off we have set around 100 thousand cases in the US, so not aligned with the EU/US Orphan Drug Designation criteria), a focus of many companies nowadays, represent approximately 17% of these indications, and are spread among a broad panel of therapeutic areas (11). Three therapeutic areas have a significant edge on the others in this specific therapeutic segment: neurology (20%), endocrine & metabolic diseases (18%) and immunology (16%).