This is the fifth part of our 2018 review dedicated to the European public biotech landscape. Check out Part 1, Part 2, Part 3 or Part 4.
The full report is now available here.
Part 5 - Table of Content
7. Deals
8. Portrait of a “typical” biotech company listed in Europe
9. Conclusion
2018 Fact Sheet
References
7. Deals
In this section, we will review the deal flow of 2018 for the companies in our universe, and make a particular focus on the out-licensing deals (excluding the in-licensing activity). As represented on Figure 41, we grouped the 119 deals signed in 2018, coming from 54 companies (36% of the total), in 6 main categories: the out-licensing deals (of products/platforms), the IP (out-)licensing deals, the R&D collaborations, the supply/distribution deals, the sales/divestments of assets (products, subsidiaries) and the Joint-Venture deals (deal model in terms of economics in italic).
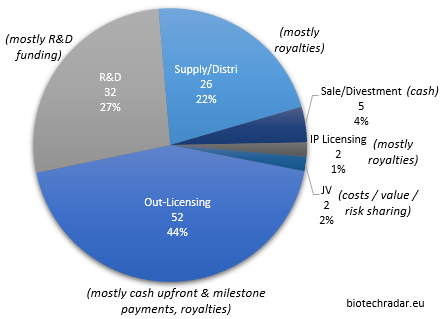
The 52 out-licensing of products in development, at various preclinical and clinical stages, represented 44% of all the 119 deals in 2018, complemented by 22% of supply/distribution deals, usually of commercial-stage products (these deals also normally include the licensing rights for the agreed territories). The remaining third is mainly composed of R&D collaborations (27%), with usually limited cash inflows in play, and sometimes small cash outflows as well.
The direct cash injections mainly came from the upfront part of the out-licensing deals, as well as sales and divestments. Overall, the total value of all the deals signed in 2018 reached more than 13.4 bEUR, including 13.1 bEUR from out-licensing deals alone. The European sector collected 1.16 bEUR of cash (all deal categories included), of which 886 mEUR from out-licensing deals only. Of note, these data only rely on the disclosed figures. For many deals, “the financial terms were not disclosed”, as it is usually mentioned in the press releases. For others, only partial data are available, typically when the split is not provided for the upfront and the milestone payments.
The fact that the total cash upfront amounts during 2018 -all deal categories included- differ from the numbers provided in section 6.2 is explained once again by the misalignment between the instantaneous recognition of the deal considerations in this section, and the actual recognition of these considerations (deferred payables from a “cash position” standpoint). For 2018, the booking of 2 large upfront payments was deferred into early 2019 (calendar year), for more than 300 mEUR: it came from 2 deals inked towards the end of the year, the argenx/Janssen and BioArctic/AbbVie deals from Table 11.
The number of deals per country/cluster (out-licensing & all-category/x-y part) are shown on Figure 42, along with the number of unique companies who out-licensed in 2018 for each country (dot size).
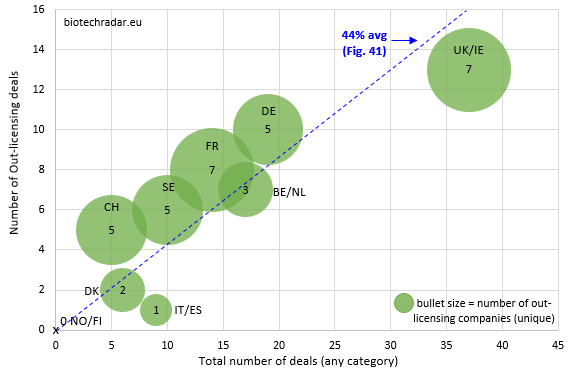
While the UK/Ireland particularly perform for the number of deals, the number of British companies who out-licensed is not really important in proportion to the deal activity. Indeed, the activity on out-licensing deals was driven by 2 “platform” companies (7 in total), Avacta and Oxford Biomedica (6 out 13 total deals). For France, the same number of companies (7) generated less out-licensing deals (8, out of 14 total deals or 57%). Of note, the total number of deals for the UK/Ireland was favorably impacted by 8 distribution deals for Lojuxta from Amryt (Ireland), and 13 R&D collaborations. Sweden, another large contributor in number of companies, did not generate many out-licensing deals (6 out of 10 total deals), in line with the lower number of late-stage assets in this country, as compared to France and UK. In Germany, the deal activity was clearly dominated by Evotec, with 12 out of 19 total deals involving the German company. Of these 12 deals for Evotec, 5 were out-licensing deals and 7 R&D collaborations, which fits once again with the business model of the company. Nevertheless, 4 other German companies managed to sign an out-licensing deal (including 2 for Morphosys). Switzerland generated 5 out-licensing deals, including 2 deals between Swiss companies in our universe (Idorsia to Santhera for an option concerning the DMD drug vamorolone, and Polyphor to Santhera for POL6014). For Belgium/Netherlands, the out-licensing deal activity (7 out of 17 total deals) only came from Mithra, argenx and Galapagos. However, the sizes of the deals, and particularly of the cash upfront payments, were particularly interesting (4 out of the Top 10 deals by cash upfront amount, see Table 11 below).
Based on data partially of fully disclosed by the companies, the Tables 11 and 12 list the Top 10 out-licensing deals in 2018, by cash upfront and total amounts. The main deal characteristics are also included (more deal details available via the service on biotechradar.eu).
| Product(s) | Indication(s) | Out-licensing Company | Clinical Stage | In-licensing company | Territories | Cash Upfront (mEUR) | Max Total (mEUR) |
| ARGX-110; cusatuzumab | AML; MDS | arGEN-X (BE) | phase 1/2 | Janssen / Johnson & Johnson (US) | WW, co-promotion option for US | 264.2 | 1585.2 |
| IPH52; IPH4301: IPH-Siglec-9; 2 Other PC targets | Solid Tumors; Lymphoma; Melanoma | Innate Pharma (FR) | pre-clinical | AstraZeneca / MedImmune (UK) | WW, co-promotion option for EU | 61 | 3832.8 |
| EVT-CELG-ONCO | Solid Tumors | Evotec (DE) | research | Celgene (US) | WW | 55.1 | 55.1+ |
| MOR106 | Atopic Dermatitis | Galapagos (BE) / Morphosys (DE) | phase 2 | Novartis (CH) | WW | 47.5 each | 472.5 each |
| MP0310 | Cancer | Molecular Partners (CH) | pre-clinical | Amgen (US) | WW | 44.1 | 482 |
| BAN805 | Parkinson’s Disease | Bioarctic (SE) | pre-clinical | AbbVie (US) | WW | 43.9 | 706.9 |
| BC Lispro; BC Combo | T1D; T2D | Adocia (FR) | phase 1b/2 | Tonghua Dongbao (CN) | CN, certain other countries | 41.3 | 111.5 |
| CF Portfolio | CF | Galapagos (BE) | phase 2 | AbbVie (US) | WW | 39.5 | 214.9 |
| Estelle | Contraception | Mithra Pharma. (BE) | phase 3 | Gedeon Richter (HU) | EU excl. BE/LU, RU | 35 | 55 |
| vamorolone | DMD; 3 Add. Indications | Idorsia (CH) | phase 2b | Santhera (CH) | WW excl. JP/KR | 30.7 | 421.5 |
| Product(s) | Indication(s) | Out-licensing Company | Clinical Stage | In-licensing company | Territories | Max Total (mEUR) | Cash Upfront (mEUR) |
| IPH52; IPH4301: IPH-Siglec-9; 2 Other PC targets | Solid Tumors; Lymphoma; Melanoma | Innate Pharma (FR) | pre-clinical | AstraZeneca / MedImmune (UK) | WW, co-promotion option for EU | 3832.8 | 60.1 |
| ARGX-110; cusatuzumab | AML; MDS | argenx (BE) | phase 1/2 | Janssen / Johnson & Johnson (US) | WW, co-promotion option for US | 1585.2 | 264.2 |
| OSE-172; Effi-DEM | Solid Tumors | OSE Immuno. (FR) | pre-clinical | Boehringer Ingelheim (DE) | WW | 1115 | 15 |
| OXB-102; AXO-Lenti-PD | Parkinson’s Disease | Oxford Biomedica (UK) | pre-clinical | Axovant Sciences (US) | WW | 715.3 | 25.5 |
| BAN805 | Parkinson’s Disease | BioArctic (SE) | pre-clinical | AbbVie (US) | WW | 706.9 | 43.9 |
| imeglimin; PXL008 | T2D | Poxel (FR) | phase 2 | Metavant / Roivant Sciences (CH) | EU, US, WW excl. Asia | 528.8 | 28.5 |
| MP0310 | Cancer | Molecular Partners (CH) | pre-clinical | Amgen (US) | WW | 482 | 44.1 |
| MOR106 | Atopic Dermatitis | Galapagos (BE) / Morphosys (DE) | phase 2 | Novartis (CH) | WW | 472.5 each | 47.5 each |
| 4 TCR targets | Cancer | Medigene (DE) | research | Bluebird Bio (US) | WW | 425.9 | 6.7 |
| vamorolone | DMD; Up to 3 add. indications | Idorsia (CH) | phase 2b | Santhera (CH) | WW excl. JP/KR | 421.5 | 30.7 |
The deal for the co-owned molecule MOR106 was actually counted twice (once each for Galapagos and Morphosys, who both are in our universe), but listed only once in the tables. The Top 10 (actually Top 11) out-licensing deals by cash upfront amount (Table 11) represented 705 mEUR or 80% of the 886 mEUR total cash upfront revenues from out-licensing deals in 2018. 4 out of the 5 deals with the largest upfront payments were in oncology. The majority of the deals (6/10) with the largest upfront payments were for clinical-stage assets, which is consistent with an increased value creation for deals signed at a later stage of development. To put things into perspective, if we look at the Innate’s deal with AstraZeneca, this deal is actually for up to 5 pre-clinical assets, and not only 1, thus the inflated cash upfront. This is also the case for the Evotec/Celgene deal, which is a broad R&D and licensing agreement for multiple targets and candidates.
Another interesting metric is the percentage of the upfront amount (including cash and/or equity) as compared to the total deal value (let’s name it U/T ratio). The median U/T ratio was 7.7% (IQR = [3.9%-16.9%]) out of 26 out-licensing deals with all the contributions disclosed (cash upfront amount, size of the equity investment when applicable, and total deal value). We will not show the data here but more than 90% of the out-licensing deals concerning pre-clinical assets (11/12) had an U/T ratio below the median, and 85% of the out-licensing deals concerning clinical assets (12/14, clinical and later stages) had an U/T ratio above the median. A simplified way to consider things is that the total deal value reflects the size of markets addressed by the licensed assets, while the U/T ratio reflects, on a first order, the stage at which the deal is signed. We will not show the data but the size of the upfront payment (cash and equity included) as a function of the total deal value clearly indicates an important gap between pre-clinical and clinical assets.
In addition, 5 out the 26 (19%) out-licensing deals with all terms disclosed included an equity investment, for a global amount of 255 mEUR: 176 mEUR for Belgium/Netherlands (JNJ in argenx), 77 mEUR in France (AstraZeneca in Innate Pharma, Metavant/Roivant in Poxel, and Sarepta in Lysogene), and 1.6 mEUR in Germany (Oncologie Inc in Mologen).
The Top 10 out-licensing deals by total deal value (Table 12) represented 82% of the 13.1 bEUR of aggregated value of all the out-licensing deals. However, on a general note, the enthusiasm about the total deal amounts has to be tempered by the fact that typically, only a relatively small amount of the “biobucks” is actually booked by the out-licensing companies over the course of the deal. This can be explained simply by the high level of attrition in drug development (below 10% chances for a drug candidate entering in clinical development to get approved, on average [22]), and also by the fact that the juiciest milestones are usually linked to sales. Being eligible to record these sales milestones implies, first, that the licensed product gets approved in at least one major market -starting with the US-, and second, that the peak sales subsequently reach the sky-high projections. All in all, the multiplying odds usually lead to high discounts when modeling the potential earnouts from the out-licensing deals.
Interestingly, 3 out of the Top 6 out-licensing deals by total deal value were inked by French biotech companies in 2018. 4 deals in the Top 10 deals were in oncology, and 2 for assets aiming at treating Parkinson’s Disease. Most of the deals (6/10) were for pre-clinical assets, all with global rights or global rights excluding Asia, or some Asian countries. Of note, the 2 most important deals by deal value included a co-promotion option for one large market, highlighting the ability of the licensing companies to potentially secure a larger part of the upside when the stakes are high.
The cash upfront and total deal value data are represented on Figures 43 and 44, respectively, for the 2018 out-licensing deals. The large variations in the numbers are better visualized in log scale (y-axis). The large spread is explained by the small number of deals per country/cluster, and the large spread (standard error) in the amounts.
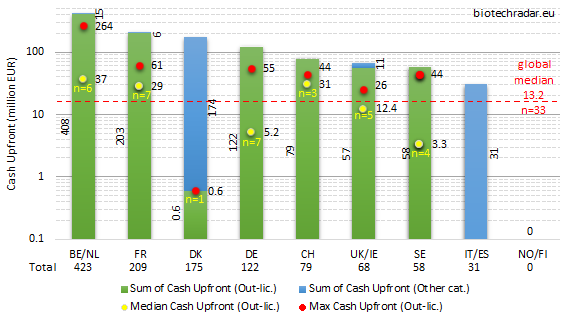
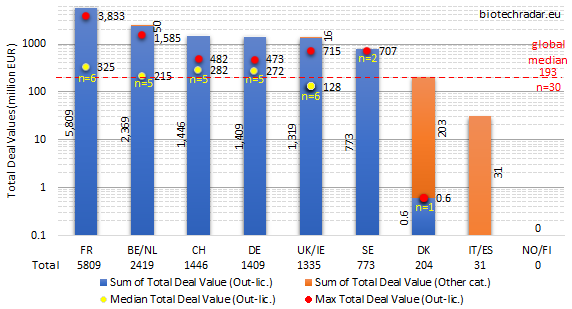
On Figure 43, one can see that the out-licensing deals logically predominated over the other deal categories, where the second highest contributions came from sales/divestments, consistently with the deal models mentioned on Figure 41. The median cash upfront amount was 13.2 mEUR out of 33 out-licensing deal with a disclosed cash upfront amount. Medians on small n’s (n≤2) were not calculated. Out-licensing deals with upfronts in the range of 50-60 mEUR in cash are statistically among the most important ones for European biotech companies, and even larger amounts are outstanding deals. The success of Belgium/Netherlands is once again highlighted on Figure 43, with more than 400 mEUR of cash collected from upfront payments (all from out-licensing deals, equity investments excluded). France collected close to 210 mEUR, nearly all from out-licensing deals, followed by Denmark with 175 mEUR (royalties’ stream sales by Zealand Pharma for 205 mUSD). 120 mEUR of cash went into the bank accounts of German biotech companies (all from out-licensing deals). Switzerland, UK/Ireland and Sweden all collected less than 100 mEUR in 2018 (79, 68, 58 mEUR, respectively).
In spite of the important out-licensing deal activity in the UK, as shown on Figure 42, the disclosed amounts of the cash upfront payments were globally below the European median for 2018. The highest cash upfront amount (26 mEUR) was also the lowest in the UK, if we exclude Denmark. Overall, UK/Ireland underperformed in 2018 on this metric. The same conclusion may apply for Sweden. The high number of companies and assets in active clinical development in these countries (see Figures 9, 11, 16, 17) did not translate in important cash inflows from out-licensing in 2018. A first reason is that, on average, the deals from companies in these countries were signed at earlier development stages (mostly preclinical or early-stage), as compared to the rest of the field. A second factor can be a relatively lower attractiveness of the assets available for partnering, as compared to the rest of the field, concerning the size of the markets, which would be supported by data from Figure 16 (lower number of indications per assets). It also makes sense that companies willing to partner at very early stages (discovery/preclinical stages), mainly for financing reasons, cannot create a significant value from multiple programs per asset.
The total deal values per country/cluster are shown on Figure 44. In terms of methodology, this chart includes two kinds of data. First, those from deals for which the total amounts were disclosed. Second, those where only the cash upfront or total milestone amounts were disclosed. In this case, we used the disclosed amount for the total deal value. Consequently, the aggregated amounts naturally underestimate the actual total deal values. For the medians, only out-licensing deals with disclosed total deal values were taken into account.
For the total deal values, France took over from Belgium/Netherlands, notably thanks to the Innate Pharma/AstraZeneca multi-asset deal in oncology in the fall last year (total deal value close up to 4 bEUR). Two deals from the Top 10 (Table 11) also contributed for France’s performance on this metric: one from OSE Immunotherapeutics (in oncology), and one from Poxel (out-licensing of a new class of agent for T2D for Europe and the US, and almost ready for a pivotal program). In contrast, Belgium/Netherlands only had one other deal in the Top 10, in addition to the argenx/JNJ deal. As shown on Figure 43, Switzerland, Germany and the UK ended more or less in the same range (1.3-1.5 bEUR). There were no disclosed data from out-licensing deals for Italy/Spain, and no out-licensing deal at all for Norway/Finland. Only one event was recorded for Denmark, but the deal terms were only partially disclosed. The median out-licensing deal size (all terms disclosed) was 193 mEUR. In agreement with previous observations, the median total deal value in the UK (128 mEUR) was also lower than the European median. Though, the highest total deal value from Oxford Biomedica’s gene therapy was the 4th largest in 2018.
Finally, we will conclude this section with the profiles of the companies who in-licensed assets from the European biotech companies in our universe, as shown on the different pie charts of Figure 45.
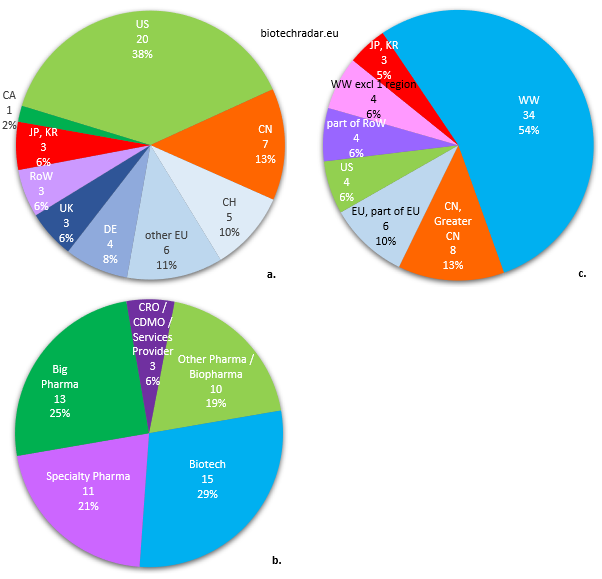
a. Country of origin of the in-licensing companies
b. Business model of the in-licensing companies
c. Territories for which the licensing applies
Out of 52 out-licensing deals, 40% were signed with companies from North America, predominantly from the US (Figure 45.a.). 35% of the deals were inked with European companies, including 25% from German, British and Swiss companies (only 1 deal each from France and Spain, none from Italy). 10 deals (19%) were contracted with Asian companies, including 7 (13%) with Chinese companies. Thanks to the regulatory changes in China over the past few years, a potential deal megatrend has been initiated between Europe and China/Greater China. Indeed, the “innovative drug” definition is broader in China [23-24]. The appetite from Chinese companies for affordable assets to serve their domestic market is an opportunity to monetize some assets for companies worldwide. However, the deal amounts (upfront and total deal value) are usually very modest. The Adocia/Tonghua Dongbao deal, ranked 7th in the Top 10 by deal upfront amount in 2018, is clearly an outlier. Only few deals (6%) were signed with companies from the “Rest of the Word”. Their contribution is more important for supply/distribution deals, when companies try to maximize their revenues through regional deals, usually post-approval.
For the category of the in-licensees (Figure 45.b.), data are somewhat well balanced. The in-licensing companies were “Big Pharma” (Top 20/Top 30 companies by market cap) for 1 deal out of 4. However, the most important contributions came from the “Biotech” segment (29%). “Specialty Pharma” companies, small or large, picked some bolt-on assets to represent 21% of the in-licensees. 19% of the in-licensees were from “Other Pharma / Biopharma” companies, including pharma/biopharma companies outside the Top 20/30 (this category may include some large biotech companies as well). A marginal contribution from “CRO / CDMO / Industry Service Providers” was also recorded. The relatively weak data from “Big Pharma” companies, who have the highest “fire power” for in-licensing deals, can be explained by a high level of requirement when picking assets, chasing mainly for the next potential blockbusters. This leaves a broad range of opportunities for the other companies in general, and principally for those with the financial means, among the “Other Pharma / Biopharma” and “Specialty Pharma” companies. The companies also need to find new assets to fill their pipeline and product portfolio, but without the necessity to hunt for a blockbuster. Indeed, they will preferably select assets for which they can handle the marketing and commercialization, fitting with their scale, strategy, and positioning. Overall, the “Big Pharma” companies are the lions of the biotech savannah: they bite first -but cherry-pick-, the rest can only eat when they are done.
Lastly, more than half of the territories (54%) for which rights were granted from out-licensing deals were concerning global rights (Figure 45.c.). This proportion raises to 60% of the territories if we add the worldwide rights excluding one region. The numbers for Asia (18%) are almost the same as the country of origin of licensees (19%), which means that the companies from these countries typically only look for rights for their domestic countries, as we already mentioned. The split between China and Japan/South Korea is also the roughly same. The last 28% of the territories negotiated included the rights for Europe or a part of Europe (10%), for the US (only 6%), and for the “Rest of the World” (also 6%). 74% (17/23) of the deals signed with “Big Pharma” or “Other Pharma / Biopharma” companies were for global rights (“WW” category only), the remaining 26% were relating to deals for China/Greater China. 73% (11/15) of the deals with “Biotech” companies were also for worldwide rights. In contrast, only 18% (2/11) of the deals signed with “Specialty Pharma” companies were for global rights. In conclusion, the licensing of global rights remains the preferred option for the out-licensing companies, and for the in-licensing companies with important financial means, even within the “Biotech” segment. This is much less the case with companies with a more focused business model like the “Special Pharma” companies. Therefore, the total deal values are also much lower with companies from this category.