6. Other financial metrics: cash burn, extra cash sources, cash balance, profits & losses
This section complements the previous part dedicated to inflows, first by comparing with the outflows (cash burns), and then by diving into the inflows again with the non-negligible contributions from extra (non-recurring) sources of cash, mainly from partners. We will finally have a look at the cash balance between all these contributions, consolidated at country/cluster level.
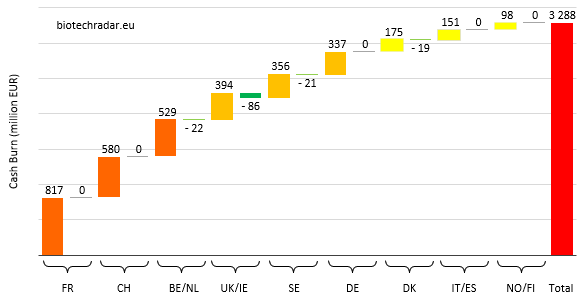
6.1 Cash burn
The amounts of cash burnt during the 2018 financial period are shown on Figure 37, by country/cluster. Before commenting this figure, we need to make a few comments and introduce our methodology. One problem is that not all the companies report their financials with an alignment of the financial reporting period with the calendar year. Around 10% of the companies report their financials with shifted periods, sometimes not even aligned with a quarter! Moreover, the reporting rules in Europe (quarterly or half-year reports) are different from the US, also being different from one country to another (some reports are only done every 6 months). This is why we will consider that the so-called “2018 financial period” data thereafter matches with the reporting periods including the larger number of months into the 2018 calendar year. For the companies reporting from 01/07 (July 1st) to 30/06 (June 30th), the “2018 period” will be the data from 01/07/2017 to 30/06/2018.
We define the cash burn by taking into account the following contributions:
• we compute the difference in cash and cash equivalents (or variants used by companies, usually including current/short-term financial instruments) from one full-year reporting period to the next (data actually available by quarter/half-year on biotechradar.eu)
• we add up the inflow contributions from financing activities (those actually taken into account for the cash and cash equivalents, not those from P&L)
• we also add up the contributions from non-recurring revenues, or “extra sources” of cash, namely cash upfront & milestone payments from partners, revenues from legal activities (e.g. awards from litigations), and business/asset divestments (e.g. subsidiaries, real estate, stakes in other companies)
• we do not add up the contributions from recurring revenues, and even if they may vary from one reporting period to the next. Are thus excluded the royalty streams, or the incomes from national R&D tax credit schemes (since we are talking about companies with high R&D expenditures, these credits are by definition recurring)
• the non-recurring expenses are excluded, since the global underlying idea is to establish “worst-case” estimates for this metric (to infer the cash runways, also available on biotechradar.eu)
Note that some companies report their “net” cash burn, while others report their “operating” cash burn. In fact, there is no standard method. As indicated by the amounts for the negative cash burn contributions (inflows) from Figure 37, only a few companies have a negative cash burn, as per our method. This usually correlates with a positive net cash flow generation. Once again, the cash burn numbers are consistent with the profile of the companies in our selection, with high R&D expenditures. Lastly, depending on companies’ accounting methods, our cash burn calculations may or may not fit with the operating expenses of the companies (see Annex 2 for a comparison).
Overall, the total cash burn reached 3.29 bEUR for the 150 European biotech companies in our selection in during their 2018 reporting period, including 3.44 bEUR of positive cash burn (cash outflows) and 150 mEUR of negative cash burn (cash inflows). The Top 3 countries found on Figure 35 (cash raised) are also the top 3 spenders -in a reverse order- with more than 500 mEUR burnt. Only ranked 7th on the cash raised, UK/Ireland is ranked 4th when it comes to the cash burn. The rest of the ranking is also almost the same as on Figure 35, except that Denmark is up by 2, in agreement with the overall comfortable cash positions of these companies. So basically, Figures 35 and 37 are very consistent. What remains positive, as a whole, is that even if 2018 was a tough year for the European public biotech companies, the amounts raised or committed during the (calendar) year were in the range of what was burnt over the 2018 reporting period. One can also see it the other way: companies globally adjusted their operating expenditures based on their cash runways.
Without statistics at company level, the interpretability of the comparison of Figures 35 and 37 remains limited, because of the variability from one company to another. We will partly answer to this question of interpretability with these numbers: approximately one third of the companies (35%) had less than 12 months of cash runway, and two thirds (65%) had more than 12 months. These numbers were calculated retrospectively by comparing the cash and cash equivalents at the beginning of the 2018 period and the cash burn at the end of the 2018 period. One third of the companies in our universe had more than 24mo of cash runway, assuming the cash burn from one year to another is constant, which actually is a best-case scenario. Indeed, it usually increases year-over-year for the correctly-funded companies. Hence, an adjustment would be required, but for simplicity’s sake, we will keep this number as is. In conclusion, we can say that between 35 and 50% of the companies had to manage their cash very carefully during the last reporting period, while around 25-30% had much more flexibility.