6.3 Balance between cash raised and burnt
In this section, 2 balances will be calculated: a first one that we will call “intrinsic”, representing the difference between the amounts raised/committed and the cash burnt during 2018 without accounting the extra cash, and a second one including the extra cash, so including “extrinsic” or non-recurring elements (even though partnering is definitely part of the business model).
The first balance “Raised - Burnt” (raised minus burnt) is represented on Figure 39, along with the “Burnt/Raised” ratio.
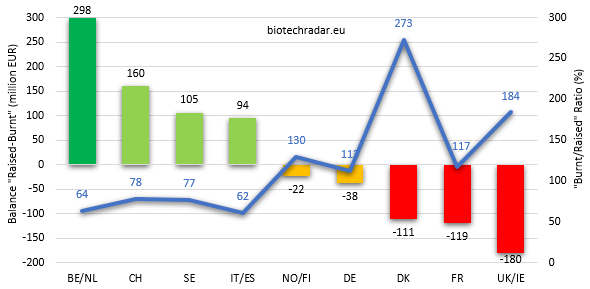
For this first balance category, 4 countries/clusters have a positive balance and 5 display a deficit. Belgium/Netherlands leads with a gap of 120 mEUR on the second place, thanks to a good health on the financing side (ranked 1st) but only the 3rd place when it comes to the cash burnt. Ranked 2nd for both the cash raised and burnt, Switzerland still ranks 2nd here. Sweden and Italy/Spain follow, with a positive balance of around 100 mEUR. Of note, Sweden has the best balance of the 3 main countries/clusters, with France and UK/Ireland lagging and even worse, ending on the bottom 2 of this ranking, both with negative balances over 100 mEUR. As highlighted before, the financing environment proved to be challenging in these countries. On the contrary, this is more a glitch for Denmark. Norway/Finland and Germany are almost neutral. The healthiest sectors had “Burnt/Raised” ratios between 60 and 80%, while those close to neutral but negative had ratios between 110 and 130%. Of note, from a ratio standpoint, France can be rated as neutral, despite an antepenultimate rank. UK/Ireland’s ratio (180%) looks bad, highlighting an unsustainable situation. These numbers can also to be compared with the number of companies or the market cap per country, but we will remain “high level” here.
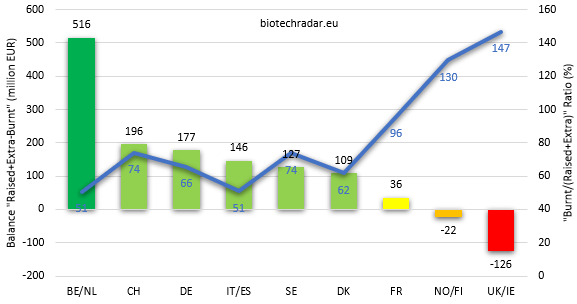
The ranking for the second balance, including the extra cash contributions (also added on ratio denominator), is shown on Figure 40. As it takes all the contributions into account, the picture is de facto more global. Only the UK/Ireland cluster exhibits a deficit, which clearly reflects the down sentiment over the British sector in 2018. The numerous clinical failures that were announced last year did not help. For France, another main contributor for the number of companies, the extra contributions managed to offset the deficit shown on Figure 39, allowing the sector to end just neutral, like Norway/Finland. Belgium/Netherland confirms its supremacy in Europe, at least on these figures, with a net positive balance exceeding 500 mEUR. All inclusive, the rest of the field demonstrates a relatively healthy situation, with positive net balances ranging from 100 to 200 mEUR. This normalization is also confirmed by ratios well below 100% for 2 thirds of the field. France’s neutral balance indicates that this metric should be under scrutiny for the next few years to come. For Norway/Finland, the small number of companies may induce more variability on this metric. UK/Ireland’s issues are once again confirmed on this chart.
In conclusion, these metrics may not be very sensitive, but they at least provide qualitative and quantitative numbers on how virtuous (Belgium/Netherlands) or difficult (UK/Ireland) a cycle can be, on the key items that are financing and cash management. Healthy, not so healthy and unsustainable situations have been spotted. One also has to keep in mind that the same way the book-to-bill indicator provides a prospective view on sales dynamics, the “Burnt/Raised” or “Burnt/(Raised+Extra)” ratios provide prospective views on how cash runways are to evolve in the near future. Finally, given that R&D expenditures are typically expected to increase on a year-over-year basis (despite an offset by the attrition on R&D programs), neutral global balances and even more negative ones, like those reported on Figure 40, provide indications on the global likeliness of negative impacts on companies’ ability to deliver in terms of product development. Operationally, low levels of financing will be translated into shifts in the timeline of certain R&D programs, or even discontinuations due to arbitrations in worse cases (the worst-case scenario being the bankruptcy, 1 case in our selection in 2019 with FIT Biotech in Finland).