
This is the third part of our 2018 review dedicated to the European public biotech landscape. Check out Part 1, or Part 2.
The full report is now available here.
Part 3 - Table of Content
3. Market data
3.1 Market capitalization
3.2 Stock performances
3.3 Market Liquidity
4. Employment
References
3. Market data
3.1 Market capitalization
At the end of 2018, the total market capitalization of the 150 European public biotech companies in our selection amounted to 43.8 bEUR (billion euros). To put this total valuation into perspective, it represents approximately one fourth of Novartis or Roche, or half of Sanofi. Not apple-to-apple comparisons obviously. The Figure 19 below indicates the market capitalization of each company, sorted from the lowest to the highest. Note the logarithmic scale on the Y-axis. The overall shape may be explained by the natural spread over various development stages, indications and by the valuation models themselves (including “leveraged” model inputs along the development of the products, like the discount rates, probabilities of success, and potentially the cost of capital). A log transformation (not shown) on the distribution tends to indicate a log-normal distribution.
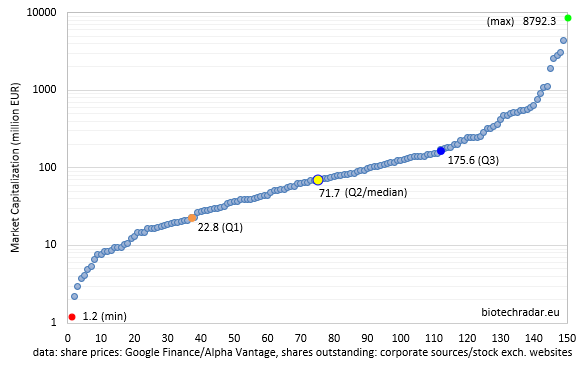
As we aimed at building a selection with a managed heterogeneity, through our inclusion and exclusion criteria, it seems this goal is globally achieved. An exponential trend engulfs approximately 80 to 87% of the companies, depending on your tolerance for what you call “a good fit” (R² ~0.99 in both cases anyways). The valuations globally follow a continuum over this exponential trend -which can be viewed as an oxymoron-, even if there are 2 tails on each side, with an accelerating trend upwards on the top end, and downwards on the bottom end. The valuations are spread over almost 4 orders of magnitude (4 logs). The median market cap at the end of 2018 was only 71.7 mEUR. One should have in mind that December was a really bad month for stocks in general (the worst since 1931 for the DJIA & the S&P500, with a clear impact in European markets at this period).
The main statistical data on market cap distribution can be found in Table 5.
| Total (million EUR) | 43786.6 | ||||
| 10th percentile | 9.4 | ||||
| 1st quartile | 23.9 | 50% of total market cap | 5 companies | 3% of the companies | |
| median | 71.7 | 75% of total market cap | 20 companies | 13% of the companies | |
| 3rd quartile | 178.8 | 90% of total market cap | 52 companies | 35% of the companies | |
| 90th percentile | 522.3 | 95% of total market cap | 74 companies | 49% of the companies |
The same shape as Figure 19 could be found for biotech companies listed on the Nasdaq markets in New York (no data/chart provided). A log transformation would also tend to indicate a log-normal distribution, however the distribution after transformation exhibits a slight asymmetry of the peak towards higher values. Even if the perimeter might not be 100% equivalent to our European universe with respect to our inclusion/exclusion criteria, we would find a median market cap of 194.2 mUSD out of 503 selected companies listed on Nasdaq (including foreign companies). With an exchange rate of 1.1482 USD for 1 EUR at the end of last year, this leads to a ratio of circa 2.3-fold between the median market cap on Nasdaq versus European markets. Attention, this DOES NOT automatically translate into “European public biotech companies are undervalued compared to the US”. The total valuation of this Nasdaq selection, excluding the “Big Pharma” companies (NYSE) and the Top 7 companies on the Nasdaq (Amgen, Gilead, Biogen, Shire, Celgene, Regeneron) was approximately 391 bUSD, or 9-fold the total market cap of our European universe.
Additional market data at the end of 2018 are presented in the Table 6 below, by country/cluster:
| EU | FR | BE/NL | DE | CH | UK/IE | SE | DK | NO/FI | IT/ES | |
| market cap (bEUR) | 43.8 | 4.3 | 9.3 | 6.5 | 3.6 | 3 | 4.6 | 10 | 0.5 | 2 |
| market cap (%) | 100 | 9.8 | 21.1 | 14.8 | 8.2 | 7 | 10.5 | 22.8 | 1.2 | 4.5 |
| median market cap (mEUR) | 70 | 97.3 | 198.1 | 85.5 | 175 | 30.1 | 41.8 | 115.8 | 36.1 | 183.9 |
| average perf. 2018 (%)* | -17 | -22 | 16.5 | -32.4 | -38 | -46.3 | 16 | -17.3 | -41.7 | -33.9 |
| median perf. 2018 (%)* | -29.3 | -27.5 | 2 | -35.6 | -39.2 | -52.3 | 0.8 | -3.1 | -37.5 | -41.9 |
| n= | 150 | 30 | 9 | 13 | 9 | 31 | 38 | 7 | 7 | 6 |
| * (incl. 5 de-listed co.) N= | 155 | 31 | 11 | 13 | 9 | 32 | 39 | 7 | 7 | 6 |
The total market capitalization, as of 31/12/2018, was 43.8 bEUR, a decline of 7.2 bEUR compared to 31/12/2017 (51.1 bEUR), of which 2.2 bEUR from acquired/de-listed companies (150 companies at the end of 2018, compared to 147 at the end of 2017). This corresponds to a variation of -14.5% on the grand total (-10.6% by excluding the de-listed companies). This variation was offset by a contribution for 1.0 bEUR of newly-listed companies during 2018. Excluding both newly and de-listed companies in 2018, the variation was -12.7% on the total value year-over-year.
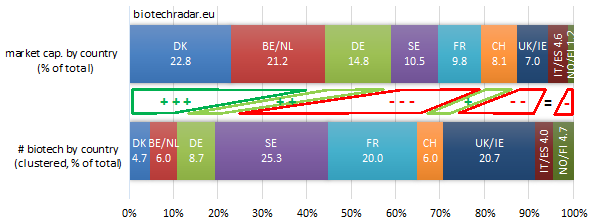
On Figure 20, Denmark and Belgium/Netherlands are overweighed in the total market valuation, thanks to Genmab and Galapagos/Argenx, respectively (see also the Top 20 European listed biotech companies at the end of the 2018, on Table 7 below). Germany and Switzerland are slightly over-represented when comparing the market cap contribution of these countries with respect to their contribution in the number of companies. The 3 largest countries/clusters (Sweden, France, UK/Ireland) are therefore underweighted, with globally a higher proportion of early-stage companies for Sweden and UK, as already reviewed in the pipeline section of this review. Moreover, other factors might explain these low figures for the French and British biotech sectors, like the high clinical failure rate for UK in 2018, or companies globally delivering below investors’ expectations for France. On top of that, one may add the financing concerns, weighing on many companies.
The same picture is rendered on the distribution of the market cap by stock exchange (Figure 21).
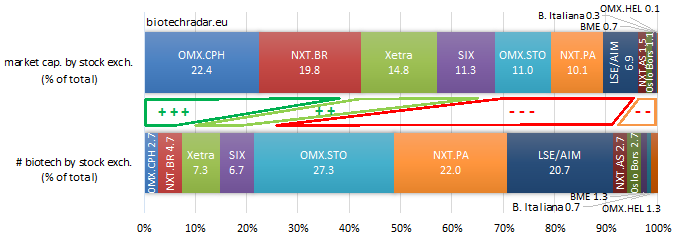
However, when consolidated by stock market operator (Figure 22), 2 main groups dominate the biotech field: Nasdaq OMX and Euronext, each representing one third of the value. Then come Xetra and SIX, in the overweight zone compared to the number of listings hosted. LSE/AIM clearly lags. Given that Oslo Børs is now part of the Euronext group, the 2 leaders get even closer in terms of number of companies, but also of market cap. Given the large discrepancies observed (Figure 21), one may sum it up this way: the quantity in the offer does not make the quality of the offer.

The Top 20 companies by market capitalization at the end of 2018 is listed on Table 7:
| Company | Market Cap (mEUR) | |
| 1 | Genmab (DK) | 8792 |
| 2 | Galapagos (BE) | 4388 |
| 3 | Argenx (BE) | 3061 |
| 4 | Morphosys (DE) | 2832 |
| 5 | Evotec (DE) | 2586 |
| 6 | Idorsia (CH) | 1887 |
| 7 | Cosmo Pharma. (IT) | 1125 |
| 8 | Hansa Biopharma (SE) | 1087 |
| 9 | Indivior (UK) | 911 |
| 10 | Mithra Pharma. (BE) | 753 |
| 11 | Cellectis (FR) | 635 |
| 12 | BioArctic (SE) | 594 |
| 13 | Oncopeptides (SE) | 570 |
| 14 | Bavarian Nordic (DK) | 552 |
| 15 | Genfit (FR) | 541 |
| 16 | Oxford Biomedica (UK) | 520 |
| 17 | Vectura (UK) | 519 |
| 18 | ObsEva (CH) | 506 |
| 19 | Innate Pharma (FR) | 475 |
| 20 | Pharming Group (NL) | 469 |
Only 8 companies made it to the “billion euro” biotech club at the end of 2018 (9 in USD). One may notice the absence of any French company in the Top 10, and the global under-representation of France and UK in general in this ranking. As a comparison, 84 companies out of the 503 selected companies on Nasdaq (similar but slightly wider perimeter) had a market cap superior to 1 bEUR (89 in USD).