3.3 Market Liquidity
The liquidity on stocks is an important metric for investors, especially for those holding large positions. In this section, we will not focus on individual stocks but on aggregated data for each main stock markets (by operator, not by places). As the level of liquidity varies significantly from company-to-company even within the same market, a finer analysis would be needed to determine what is actually the “most liquid market”. However, we will not provide these data in this introductory report, and we will only report top-level data. The Figure 28 shows the moving average over 5 sessions (MA5) of the turnovers on each main European stock market. The MA5 was chosen to smoothen the curves, as the daily turnovers can exhibit large variations. Because of the large spread observed for the amounts traded on the various markets, we use a log scale on the y-axis, which has the effect to tighten the excursions of the curve. It also prevents plotting issues of null values on the log scale.
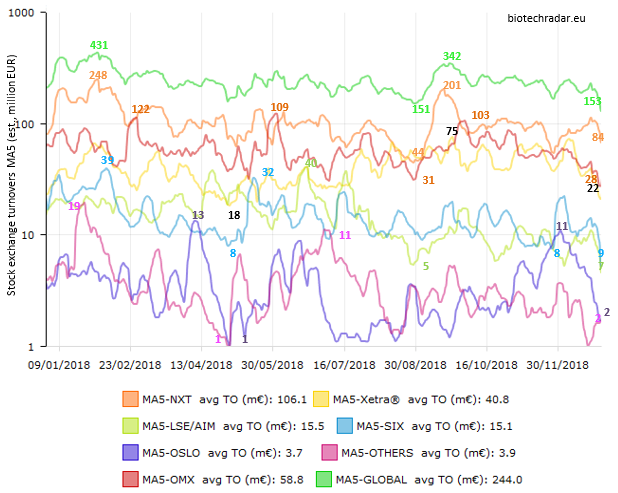
The MA5 basically represents the average turnovers over a week. By using averaged values, a slight delay in the curve responses is induced, but as the time constant is very short, this is a negligible point. The “Others” category includes the turnovers of Borsa Italiana (Milan, Italy) and Bolsa de Madrid (Spain). These turnovers’ data are based on estimates, relying on a formula using as inputs the classical end-of-day data. These estimates typically provide an accuracy well below 5%, except, potentially, with high levels of intraday volatility (then data are usually corrected with the data reported by the stock market operators themselves).
The universe on which these liquidity data are reported is also slightly extended, with some companies not matching our selection criteria, and 16 selected diagnostic (DX) companies. However, the DX companies do not really induce a lot of distortion, as all the data are highly dominated by the biotech sector. To illustrate this, even if Biocartis (Belgium) had a market cap of 511 mEUR at the end of 2018 (so 3-4% of the total on Euronext), the turnovers on Biocartis stock were only between 0.5 and 2 mEUR, typically, over 2018.
The aggregated daily turnover at the European level was of 244 mEUR, on average, for 2018 (our universe of select markets). The most active markets were those managed by Euronext (106 mEUR average daily turnover). In fact, this has been the leading place for quite some time now, as they cover both the dynamic Belgium/Netherlands hotspot, along with the large number of companies in France. These data will be complemented by the much more modest 4 mEUR from Oslo Børs from 2019 onwards. The Nasdaq OMX Nordic markets took the second spot with an average of 59 mEUR, thanks to one very large cap (Genmab), and the large number of Swedish companies. The turnovers on Nasdaq OMX spiked occasionally over those on Euronext, but not for long period. The German markets from XETRA are on the third rank (41 mEUR, on average in 2018), mainly thanks to Morphosys and Evotec. During the second half of the year, the turnovers were almost on par with those from Nasdaq OMX. Then, there is a gap again with the LSE/AIM and the SIX Swiss Exchange (averages of 15-16 mEUR each). The very negative trend on LSE/AIM turnovers was clear during the summer, correlating mostly with the plummeting stock of Indivior. The turnovers on SIX included only 10 companies, versus 38 for LSE/AIM (incl. 4 DX), but compared to the total market cap on each market at the end of 2018 (Figure 29), both ended under-represented. This was more marked for the SIX markets than the LSE/AIM markets.
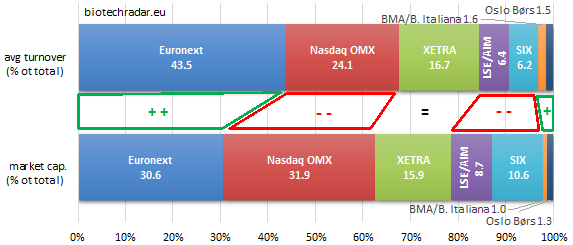
Overall, from Figure 29, the Euronext markets present the most attractive picture in terms of market liquidity. Further metrics support this assertion (not discussed here). The German markets are also quite strong, all things being relative. The 3 main European markets in valuation (78.4% of the extended universe) gathered 84.3% of the turnovers.
This is also illustrated on Figure 30 below, on the MA20 of the turnovers. Here we used the moving average over 20 sessions to smooth the curves even more, and capture the mid/long-term trends more easily, still by inducing an approximately 1-month delay on curve responses. The domination of the 3 markets previously mentioned is even more obvious here. This representation also allows to capture the market dynamics, like the loss of share of LSE/AIM (UK) during the summer and the rise of the XETRA (DE) over the same period. Following the acquisitions Ablynx (a “large” market cap for a European biotech company), turnovers on Euronext peaked accordingly at the end of January/early February, as observed with a delay on the MA20. Then a global decline of the turnovers followed, over 8 months (seen on Figure 28), mainly due to lower turnovers on Euronext. Of note, TiGenix and Ablynx were de-listed in June and July, respectively, explaining partly this decay through the summer. After the summer, and the rebound or turnovers in September, another mid/long-term decline took place, more correlated with deflating turnovers from Nasdaq OMX. This decline also last lasted 8 months into 2019, leading to concerningly low turnovers, actually the lowest over the past 2 years.
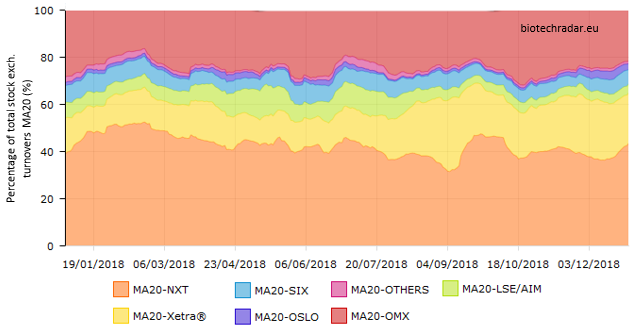
As there is no straight correlation with the evolution of total market cap, it seems that many international institutional investors left the European biotech markets over this period. One may wonder how the emergence of the Hong-Kong markets could have impacted the liquidity in Europe for biotech companies. Indeed, thanks to the new regulations allowing non-profit-generating companies to list on public markets, many biotech/biopharma/pharma companies floated in Hong-Kong in 2018, mainly over the second half. It has to be noticed that 4 out of the top 5 largest 2018 IPOs on the sector took place in Hong-Kong [21]. Even though the profile of these companies is much more late-stage and with broader pipelines than the typical European biotech company, potential arbitrations may have occurred at the expense of Europe, in terms of fund flows.