3.2 Stock performances
2018 was a negative year for stocks in general. In Europe, the main indexes were down 11% for CAC40 (FR), 18.3% for the DAX (DE), 18.5% for the BEL20 (BE), 12.5% for the FTSE100 (UK) and 14.3% for the EUROXTOXX 50. In the US, the Down Jones lost 5.6% versus 6.5% for the S&P500, while the Nasdaq Composite declined by 3.9%. The Japanese NIKKEI also lost 12.1%.
In the US, the biotech ETF XBI (equal-weighted) lost 15.5%, and the IBB ETF lost 9.7%, which is worse than the main indices mentioned before. The conclusion is the same for European biotech stocks, when compared to the main European indices. Indeed, the small caps compartment was not likely to outperform in a context where the market sentiment was globally negative (trade war, US Fed rates) and even more in Europe (lack of growth and structural reforms, Brexit, despite a supportive ECB policy over the past years). Overall, the full-year 2018 stock performance for the 155 biotech companies in our list (150+5 de-listed) was -17% on average, or -29% for the median (see previous Table 6), which is consistent with the “High Beta” profile of this subsector. Despite a very tough end of year on the markets, 2 countries/clusters managed to end in positive territory, for both their average and median performances (barely positive for the latter): Belgium/Netherlands, and Sweden (note the spread between the mean and median performances). UK biotech stocks lost roughly half of their value on average, but more impressively also on the median, with a long list of clinical trial failure. Denmark did relatively well, as compared to France, Germany, Switzerland, the Nordics and the Southern Europe.
The list of the FY18 stock performances >50% can be found in Table 8.a, while those < -50% are shown in Table 8.b. Out of the 5 de-listed companies, given that 4 of them were acquired, their performances were consistent with the application of a premium.
Oasmia jumped after the European approval of Apealea (nanoparticle formulation of paclitaxel), Bioarctic soared thanks to the surprise success of BAN2401 phase 2b in Alzheimer (run by Eisai/Biogen). The speculation over Cantargia’s anti-IL1RAP brought the stock to new highs, while IRLAB Therapeutics capitalized on the successful proof-of-concept of IRL752 in Parkinson’s. Only 7 companies more than doubled.
| Company | Country | FY18 % |
| Oasmia Pharma. | SE | +249.2 |
| BioArctic | SE | +215.4 |
| Wilson Therapeutics * | SE | +129.1 |
| Cantargia | SE | +121.9 |
| IRLAB Therapeutics | SE | +120.3 |
| Ablynx * | BE | +117.2 |
| Diamyd Medical | SE | +104.1 |
| Mithra Pharmaceuticals | BE | +94.9 |
| Xintela | SE | +88.1 |
| TiGenix * | BE | +83.5 |
| Active Biotech | SE | +73.0 |
| Quantum Genomics | FR | +69.5 |
| TxCell * | FR | +67.5 |
| Oncopeptides | SE | +64.3 |
| Argenx | BE | +62.2 |
| Oxford Biomedica | UK | +59.8 |
| Innate Pharma | FR | +56.6 |
For the decliners, FIT Biotech managed to realize the extraordinary performance to divide its stock price by more than 40-fold, because of financing issues and a terrible snowball effect from convertibles, all combined with a low liquidity on the stock. These troubles eventually killed the company who went into administration at the beginning of 2019. Immupharma plunged on the pivotal trial failure of Lupuzor. Faron collapsed on its lead Traumakine phase 3 failure in ARDS. A1M delayed the entry in clinics of their first candidate, while Summit Therapeutics crashed on vanished hopes in Duchenne Muscular Dystrophy. The following reasons (at least one for each company) drove the decliners’ stock performance listed in Table 8.b: clinical failures, financing issues, regulatory setbacks, delayed plans, legal issues, strategic decisions, deceptive sales, etc...
British biotech companies represent 35% (17/49) of the decliners’ list, highlighting a sobering year (with a notably bad impact for the Woodford fund into 2019). France is also well represented among the Top decliners, with 11 companies (22%). There is no Danish company in this ranking (but low number of companies in Denmark).
| Company | Country | FY18 % | Company | Country | FY18 % |
| FIT Biotech | FI | -97.6 | 4D Pharma | UK | -70.4 |
| Immupharma | UK | -93.1 | Erytech Pharma | FR | -66.2 |
| Faron Pharma. | FI | -92.9 | Acacia Pharma | UK | -64.4 |
| A1M Pharma | SE | -90.1 | Biophytis | FR | -63.8 |
| Summit Therapeutics | UK | -88 | AB Science | FR | -58.4 |
| Hybrigenics | FR | -87.1 | Lysogene | FR | -57.9 |
| Mologen | DE | -85.9 | Targovax | NO | -57.9 |
| Diurnal Group | UK | -85.6 | Neovacs | FR | -56.5 |
| Noxxon Pharma | DE | -83.9 | Destiny Pharma | UK | -56.5 |
| Midatech Pharma | UK | -83.3 | Pharma Mar | ES | -56 |
| Realm Therapeutics | UK | -82.4 | Tiziana Life Sciences | UK | -55.9 |
| ValiRx | UK | -81.3 | Kancera | SE | -55.5 |
| Santhera Pharma. | CH | -81.3 | ASIT biotech | BE | -55.1 |
| Cyxone | SE | -77 | co.don | DE | -53.8 |
| Probiodrug | DE | -76.1 | NeuroVive | SE | -53.7 |
| DBV Technologies | FR | -74.7 | Polyphor | CH | -53.1 |
| ReNeuron | UK | -74.3 | Avacta | UK | -52.3 |
| Cerenis Therapeutics | FR | -74.3 | Celyad | BE | -52.1 |
| Crossject | FR | -73.9 | Allergy Ther. | UK | -51.8 |
| Shield Therapeutics | UK | -73.3 | Newron Pharma. | IT | -51.6 |
| Silence Therapeutics | UK | -73 | Karessa Pharma | SE | -51.6 |
| Sensorion | FR | -72.7 | Camurus | SE | -50.8 |
| Indivior | UK | -72.5 | Nicox | FR | -50.6 |
| Annexin Pharma. | SE | -70.9 | Medivir | SE | -50.4 |
| Redx Pharma | UK | -70.7 |
The waterfall plot in Figure 23 recapitulates the full-year 2018 stock performances of the 150 biotech companies in our selection, plus the 5-delisted companies during 2018. With the colors, one can easily see the outperformance of Belgium/Netherlands and Sweden, and the underperformance of UK/Ireland. For France, the pattern is quite dichotomic, with a group between -50 and -75%, and another one between +10 and +70%. A similar pattern can be observed for Denmark, but with a much lower number of companies and in other ranges. The Annus Horribilis of the British biotech sector, with bad news all year long, can also be visualized on Figure 24, representing the heatmap of the stock performances throughout the year. As the markets mostly ended on their lows, the information out of this figure might be a bit redundant with the waterfall plot. The strong second half of the Swedish sector (also on Figure 25), the strong start of Belgium/Netherlands, and the tough last quarter of France are the most recognizable patterns. The impact of the market correction occurring in Q4 can also be spotted.
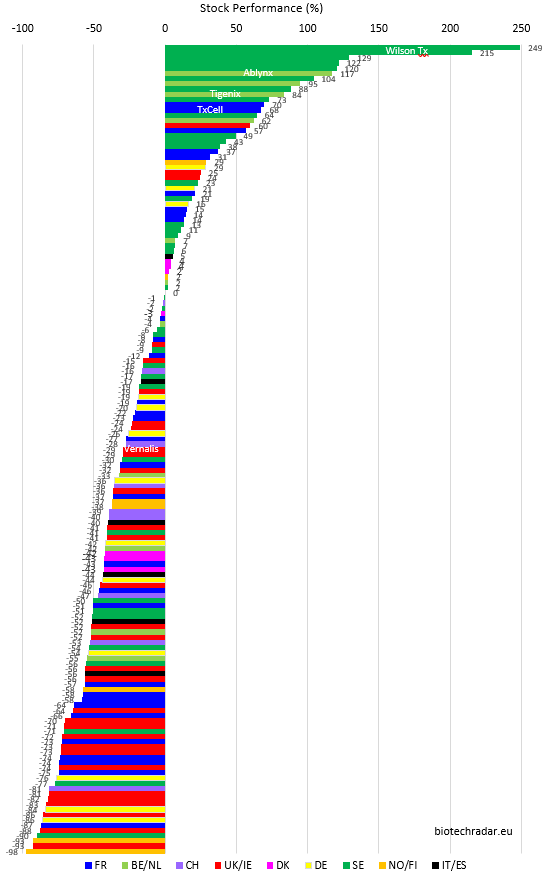

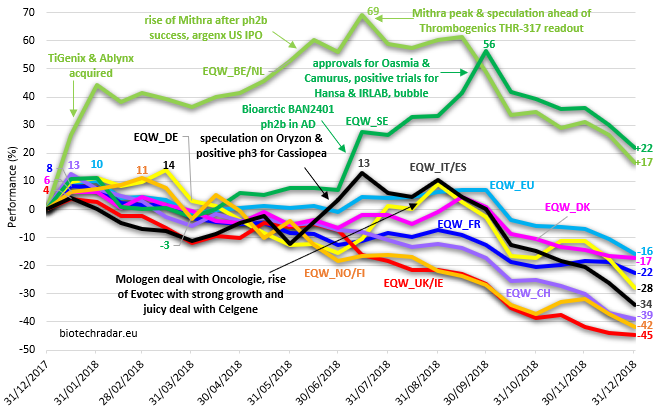
The performances are also shown on Figure 25 in the forms of equal-weighted indices, for Europe and for each by country/cluster. Thanks to the periodic runup caused by the JP Morgan Annual Healthcare Conference each year, early in January, 4 out of the 9 countries/clusters peaked at that time before fading down almost all year long. The global European index also peaked in January, driven by the 2 acquisitions on TiGenix and Ablynx. Norway/Finland and Germany also peaked a bit later during the first quarter 2018. Belgium/Netherlands went basically flat after a strong kickoff (2 buyouts mentioned before), and peaked in July thanks to Galapagos (deal for MOR106). Sweden had a mostly neutral trend before the surprising phase 2b results of BAN2401 in Alzheimer’s Disease in July. Once initiated, this good momentum was kept with drug approvals for Oasmia and Camurus, a positive outcome in a patent litigation for Orexo, positive trials for Hansa or IRLAB Therapeutics, and bubble-like speculation moves on many small Swedish companies like Cantargia, Xintela, Diamyd, Corline, Active Biotech, among others. Germany and Italy/Spain managed to transiently rebound before the general drop of stocks during the Fall and December. All the indices were down in Q4 2018, mainly due to macroeconomic factors.
The 2018 performance of our European biotech index, in both equal-weighted and cap-weighted versions, is compared with 2 reference US (or mostly US) biotech ETFs on Figure 26, the SPDR S&P BIOTECH “XBI” (equal-weighted) and the iShares Nasdaq Biotechnology “IBB” (cap-weighted). For the cap-weighted index, we limited the contribution of the largest weights to 8%, which is more or less the largest holdings in the “IBB” ETF. For simplicity’s sake among other things, there was no rebalance applied during the year, nor any float-adjust.
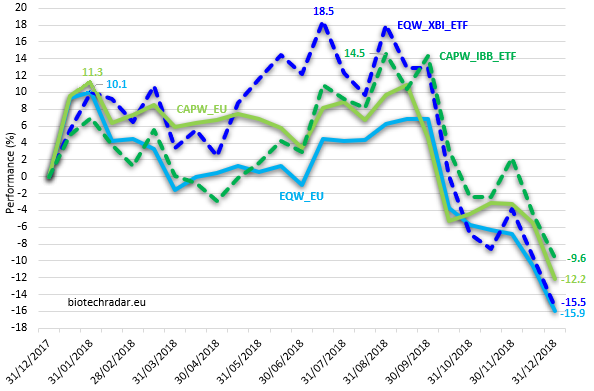
The sector boost in January was also noticeable for the US ETFs, thanks to the “JP Morgan Conference” and overall well-oriented markets. Investors were anticipating a wave of M&As, which was materialized e.g. by the Celgene/Juno and the Sanofi/Bioverativ deals. A large sell-off took place on the markets in February, which according to the indices, even if global, mostly impacted the smaller caps in Europe and the larger caps in the US. Then the “trade war” between the US and China started at the end of March. The US smaller and midcaps managed to outperform the larger caps until the 2-step global market corrections, in October and December (incl. concerns on inflation in the US, Fed rates, trade war intensification, etc...). In this context, the free fall was general. For the US biotech sector, the XBI ETF actually corrected even more than the IBB ETF. For the European biotech sector, the larger caps started to correct slightly before but all the end points converged between -10 and -15%.
Overall, the European performance for larger caps was almost only due to the beginning of the year and neutral until the autumn correction (see also Figure 27 below). For the European smaller caps, the market correction in February annealed all the early gains. A small rebound was initiated by the Swedish biotech sector during the summer but it could not offer any resistance to the market sentiment reversal later in the second half. The US biotech sector had a very strong second quarter and summer before the free fall.
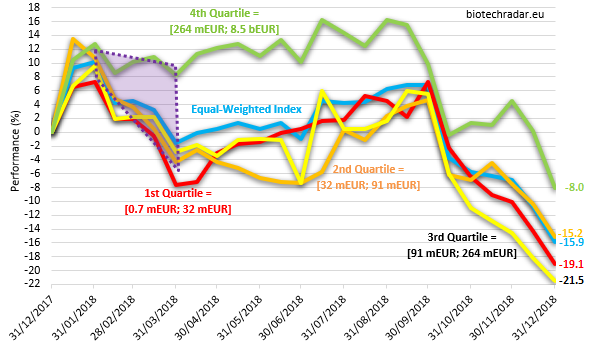
On Figure 27, we represented the stock performances by quartiles of the market cap, determined at the end 2017 (1st quartile=Bottom[0%;25%], 2nd quartile=[25%;50%], 3rd quartile=[50%;75%], 4th quartile=Top[75%;100%]). The outcome is very straightforward: the companies with the largest valuations did better in 2018 (this is not always the case). However, this outperformance is only due to the 2 months of February and March, the trends being very similar otherwise for the rest of the year. Thanks to the heatmap analysis (not shown), we found that this outperformance over this particular period for top (4th) quartile was driven by 3 factors. The first one is that there were less decliners, in proportion, compared to the other quartiles. The second factor is that the amplitude of the decline was, on average, lower than on the other quartiles. The third factor, to a lesser extent, concerns 1 Belgian company (Mithra), whose stock soared over the period. In terms of distribution at the end of 2018, there were slightly less companies in negative territory in the top quartile versus the rest of the distribution (62% versus 71%, respectively). Moreover, the average performance of both the decliners and gainers was slightly better in the top quartile versus the other 3 quartiles pooled altogether (-44.8% versus -48.3%, respectively for the decliners, and +52.4% versus +48.2% for the gainers). These elements explain the significant outperformance of the largest caps at the end of 2018.
Finally, excluding macro factors and the early January general sector boost, the correlation between the European and US sector performance was globally weak, which can be explained by the large gaps between the 2 ecosystems. A good example was the number of IPO in 2018, around 50 in the US, the second largest number of the decade (peak in 2014) [16;19-20], while the trend was the exact opposite in Europe (lowest since 2013). On a more positive note, one can also notice that despite challenging market conditions, the European biotech sector did not particularly underperform its US peers. If we compare the relative performance of the main indices, the European indices underperformed the US ones more markedly.