4. Employment
The 150 companies in our universe counted approximately 15500 employees or FTEs (Full-Time Equivalent employees) at the end of 2018 (or during 2018 for the FTEs). Not all the companies disclose the number of employees at the end of their reporting period, thus the mix. Knowing that this sector drives mainly high-payroll jobs and offers some opportunities for the PhDs, this is an interesting metric to study. This topic could potentially be the subject of further reports.
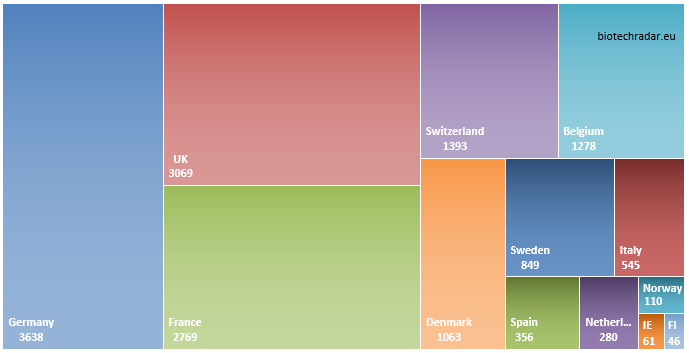
The number of employees/ FTEs per country, at the end of 2018, is shown on Figure 31.

The 3 leading countries, by a margin, are Germany, UK and France, representing more than 60% of the total altogether (61%). However, Germany clearly owes this leading position to Evotec, with more than 2600 employees as of 31/12/2018, or 70% of the total of the country. This is explained by the business model of the company, who provide a range of services including drug discovery (segment not covered). That makes the company an outlier for the employment metric, as compared to the rest of our universe (together with the much smaller Oncodesign in France). For the UK, Indivior also gathers circa 30% of the UK total. The British company had already announced that many job cuts would occur in 2019, following the patent cliff for their leading product Suboxone. Given the resilience of the product in the first half of 2019, perhaps these cuts will be smoothed or hopefully decreased or delayed, but the trend is clearly going south. Last on the podium, France numbers are distributed more evenly, unlike Germany of the UK. Switzerland, Belgium and Denmark follow, all with numbers ranging between 1000 & 1500 employees/FTEs. Idorsia and Galapagos account for 54% and 57% of their national total numbers, respectively. Two Danish companies, Bavarian Nordic (419) and Genmab (377) gathered 75% of the employees. Consistently with the profile depicted in this review, Sweden only had 849 employees at the end of last year, because of the “youth” of the companies in general. In addition, many of the Swedish companies in our universe adopted a “virtual biotech” model (where basically everything is outsourced). Indeed, 46% of them had 10 employees/FTEs or less, which is by far the largest proportion in our universe. Finally, Italy, Spain, the Netherlands, 2 Nordic countries and Ireland included approximately 1300 jobs altogether.
On Figure 32, the proportion of employees per country/cluster is compared to the proportion of the number of companies in each country/cluster. The best performers in terms of employment are Germany, Belgium/Netherlands, Switzerland, Denmark, whereas those with the lower impact are the Nordic countries in general.
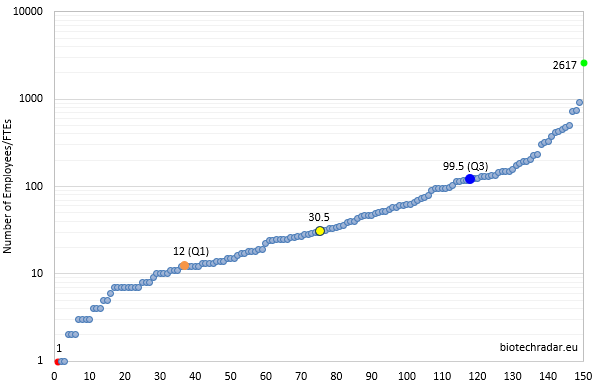
Finally, the number of employees/FTEs in each company is shown on Figure 33. The readers will observe the striking similarity with the shape on Figure 19 (market cap of the companies), also with a wide exponential part (attention, these are not the same companies on the x-axis for each chart, due to the selective sorting for each data series). Without looking at data per company but at a global level, a straightforward model consists in establishing a proportional relationship between the number of employees/FTEs and the market cap on the companies, so that the market cap (in mEUR) is equal to 2.1-fold the number of employees/FTEs (regression on log10 of data series with the method of least squares). However, when comparing this law for each company, we observe a significant spread above and beyond the model curve. We will not go further in this introduction, however there are interesting comments to do from such a modeling.


