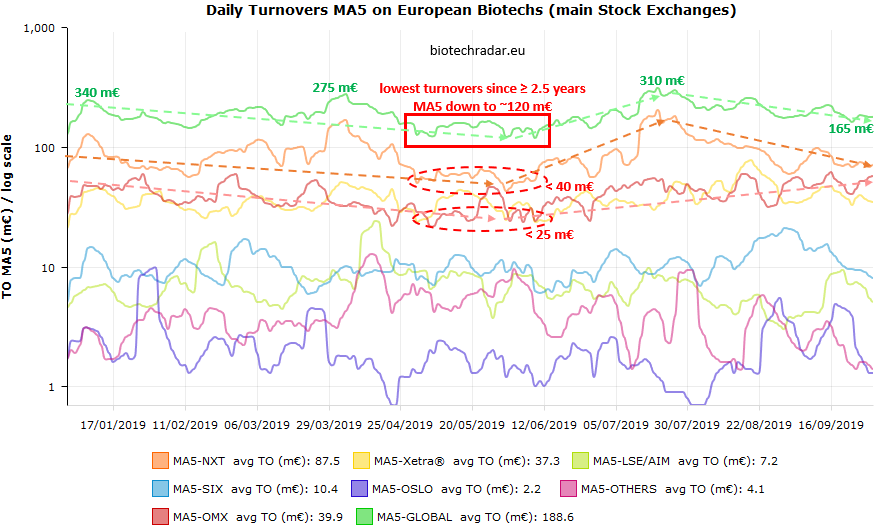
The stock markets liquidity is shown below for the all the European stock exchanges (by market operator). We use the MA5 to smooth the turnover (TO) curves over a trailing week. The most striking thing was the continuous fall of the turnovers that last for 8.5 months, from the middle of September 2018 until the end of May 2019, when a bottom was reached. Euronext (main markets in France, Belgium, Netherlands) being the market operator with the largest level of turnovers on the listed biotech sector in Europe, the correlation of the global trend is implicit. However, on a second order, it is pretty clear, by un-zooming over the period mentioned previously, that a significant part of the fall in overall turnovers also stem from a clear down trend on Nasdaq OMX (main markets in Sweden and Denmark).

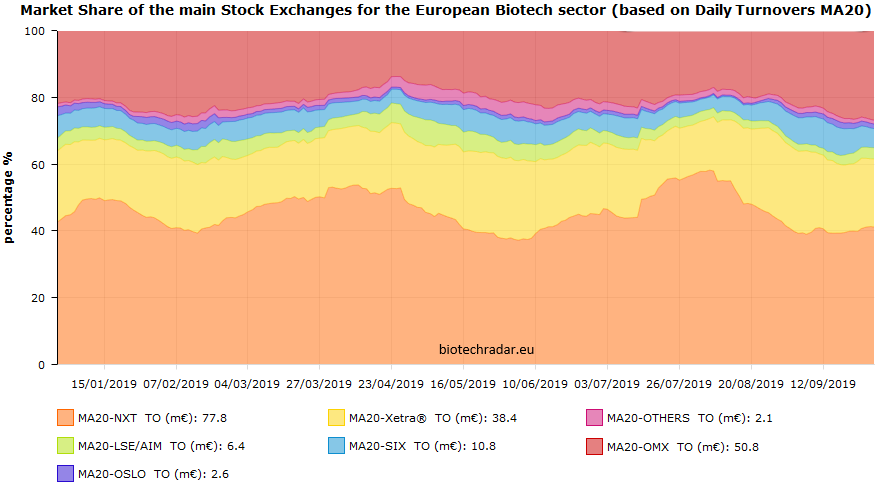
The share of turnovers on Euronext markets oscillated between 40 and 60% so far in 2019 on listed biotechs in our universe, reaching a low at the end of May. With more than 3-fold less companies than Sweden / Denmark / Finland, and a more than 2-fold lower total market cap, the share in liquidity on Deutsche Börse XETRA was sustained a share around 20-25% during the first 9 months of 2019, which turns out to be similar to Nasdaq OMX. The share in liquidity on LSE/AIM went also down at the beginning of the Summer. Same trend of Italian/Spanish stock exchanges ("Others").