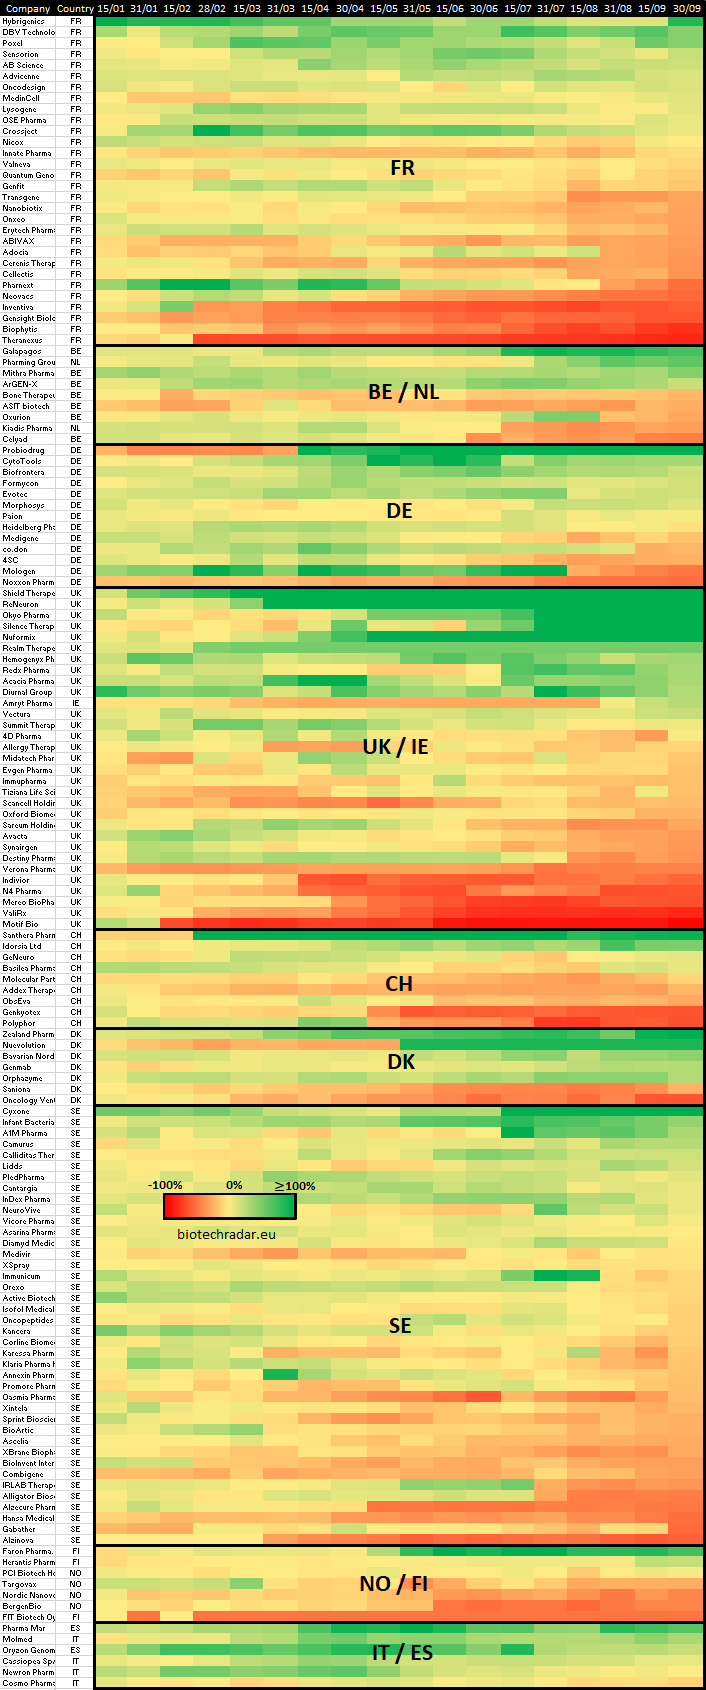
The figure below represents the heatmap of the stock performances of the European listed biotech companies for the first 9 months of 2019. The companies are grouped by country/cluster. Within each country/cluster, the performances are sorted from highest to lowest, as of 30/09/2019.