2021 stock performances
The stock performance of the 172 European public biopharma companies in our universe was -18.7% on average, in 2021 (companies listed as of 31/12/2020, plus those newly listed on the main European marketplaces during 2021). The median performance was even worse, with -28.7%, meaning the performances were heavily skewed in very negative territory for most of them (73% of the field ended negative, see the waterfall plot on the next page). This represents an important fall after the 2020 madness around COVID (mean +63% / +12.9% / -17% & median +14.3% / -8.1% / -29% in 2020 / 2019 / 2018, respectively), with a sentiment reversal on the sector from mid-February onwards, and lasting. Last year, selectivity based on fundamentals or other considerations (outside COVID-19) was not a good strategy to maximize the performance but selectivity had to be back in 2021. Indeed, the worst performing companies were the smallest ones by valuation at the end of 2020 (Perfs by IQR range, from lower to higher: -26.2% / -18.7% / -10.9% / -8.9%, versus -16.2% for our Equal-Weighted Index).
As we highlighted in last year’s review, many companies had their valuation pumped by the disclosure of programs to investigate their agents as therapeutics for COVID, or to develop prophylactic vaccines. These intents were, sometimes, not even followed by any facts, and unfortunately, on the therapeutics side, most of the clinical datasets disclosed in 2021 were rather inconclusive, or too preliminary to provide much confidence, or they simply yielded negative outcomes. Therefore, the Russian roulette did not end well for most of the COVID plays. For some, the jury is still out, but the therapeutics landscape is now well occupied by large players, on the antibody side, and on the antiviral side. Still, there is still an opportunity in the hospitalized setting, and especially in the ICU setting. Out of a pool of 47 “COVID” stocks (companies who have expressed an intent to investigate one of their compounds in COVID, or who actually ran clinical trials in COVID), the 2021 average performance was -14.8% (+148.7% on average in 2020 for 42 COVID stocks), and the median performance was -31.4% (+47.1% in 2020). In summary, many of these COVID plays already went back where they were before the pandemic. For 125 “non-COVID” stocks, the mean performance in 2021 was -20.1%, with a median performance of -27.8% (113 non-COVID stocks in 2020, with mean performance of +31.1%, and a median gain of 6.5%). So, the average loss was more important in 2021 for non-COVID stocks, but this is largely due to the fact that the best performance of 2021 actually was a COVID play (Valneva, a vaccine manufacturer), whereas the median loss was higher for COVID stocks than for non-COVID stocks, which is what one would have expected.
| Company | Country | FY21 perf % | |
|---|---|---|---|
| 1 | Valneva | FR | 216.1 |
| 2 | Abionyx | FR | 147.2 |
| 3 | Indivior | UK | 136.2 |
| 4 | Vivoryon | DE | 110.4 |
| 5 | Sareum Holdings | UK | 102.1 |
| 6 | Allergy Therapeutics | UK | 94.0 |
| 7 | ValiRx | UK | 85.9 |
| 8 | Hyloris Pharma. | BE | 82.1 |
| 9 | Arecor Therapeutics | UK | 77.0 |
| 10 | Transgene | FR | 53.9 |
| 11 | Destiny Pharma | UK | 53.3 |
| 12 | BivicTriX Therapeutics | UK | 47.5 |
| 13 | Nordic Nanovector | NO | 46.7 |
| 14 | Bavarian Nordic | DK | 43.7 |
| 15 | Scancell Holdings | UK | 42.9 |
| 16 | OSE Pharma | FR | 42.8 |
| 17 | Ultimovacs | NO | 41.0 |
| 18 | Evotec | DE | 40.4 |
| 19 | XBrane Biopharma | SE | 40.1 |
| 20 | Redx Pharma | UK | 37.6 |
| 21 | Synairgen | UK | 35.9 |
| 22 | Medivir | SE | 34.9 |
| 23 | co.don | DE | 32.3 |
| 24 | argenx | BE | 30.3 |
| 25 | GeNeuro | CH | 29.1 |
| 26 | Innate Pharma | FR | 28.6 |
| 27 | Sensorion | FR | 28.4 |
| 28 | BioArctic | SE | 24.9 |
| 29 | Oxford Biomedica | UK | 19.4 |
| 30 | Pherecydes Pharma | FR | 15.0 |
| 31 | OncoZenge | SE | 12.8 |
| 32 | Emplicure | SE | 12.3 |
| 33 | Formycon | DE | 11.3 |
| 34 | Genkyotex | CH | 10.9 |
| 35 | Avacta | UK | 10.9 |
| 36 | Genfit | FR | 7.9 |
| 37 | Nykode Ther. | NO | 7.6 |
| 38 | Genmab | DK | 6.8 |
| 39 | IRLAB Therapeutics | SE | 4.8 |
| 40 | Kiadis Pharma | NL | 3.4 |
| 41 | Faron Pharma. | FI | 2.9 |
| 42 | Mithra Pharma. | BE | 1.4 |
| 43 | Guard Therapeutics | SE | 1.4 |
| 44 | ASIT biotech | BE | 0.9 |
| 45 | BioInvent Internat. | SE | 0.7 |
| 46 | Inventiva | FR | 0.2 |
| 47 | Diurnal Group | UK | 0.0 |
| 48 | Klaria Pharma | SE | -0.5 |
| 49 | ReNeuron | UK | -0.6 |
| 50 | Maat Pharma | FR | -1.1 |
| 51 | MedinCell | FR | -2.0 |
| 52 | Corline Biomedical | SE | -2.3 |
| 53 | Adocia | FR | -2.4 |
| 54 | ObsEva | CH | -3.1 |
| 55 | Okyo Pharma | UK | -4.7 |
| 56 | Advicenne | FR | -4.8 |
| 57 | Poolbeg Pharma | UK | -5.0 |
| 58 | Crossject | FR | -7.2 |
| 59 | PledPharma | SE | -10.1 |
| 60 | Quantum Genomics | FR | -12.5 |
| 61 | Molecular Partners | CH | -14.1 |
| 62 | Oncodesign | FR | -14.2 |
| 63 | Philogen | IT | -15.6 |
| 64 | Alzinova | SE | -16.4 |
| 65 | Combigene | SE | -16.9 |
| 66 | ABIVAX | FR | -17.0 |
| 67 | Initiator Pharma | DK | -18.1 |
| 68 | Medigene | DE | -18.5 |
| 69 | Amryt Pharma | IE | -19.1 |
| 70 | Camurus | SE | -19.1 |
| 71 | Gabather | SE | -19.1 |
| 72 | Calliditas Ther. | SE | -19.2 |
| 73 | Pharma Mar | ES | -19.7 |
| 74 | Abliva | SE | -21.9 |
| 75 | Gensight Biologics | FR | -22.0 |
| 76 | Toleranzia | SE | -22.6 |
| 77 | Cosmo Pharma. | IT | -22.8 |
| 78 | Oryzon Genomics | ES | -22.9 |
| 79 | Basilea Pharma. | CH | -23.0 |
| 80 | Poxel | FR | -23.2 |
| 81 | Lytix Biopharma | NO | -23.6 |
| 82 | Medesis Pharma | FR | -23.7 |
| 83 | Pila Pharma | SE | -24.4 |
| 84 | Newron Pharma. | IT | -24.7 |
| 85 | Idorsia | CH | -27.0 |
| 86 | Lysogene | FR | -27.8 |
| 87 | Oxurion | BE | -29.1 |
| 88 | DBV Technologies | FR | -29.5 |
| 89 | Shield Therapeutics | UK | -29.9 |
| 90 | Orexo | SE | -31.0 |
| 91 | Midatech Pharma | UK | -31.1 |
| 92 | Heidelberg Pharma | DE | -31.4 |
| 93 | Active Biotech | SE | -33.1 |
| 94 | Xintela | SE | -34.0 |
| 95 | Zealand Pharma | DK | -34.2 |
| 96 | Alzecure Pharma | SE | -34.3 |
| 97 | Scandion Oncology | DK | -34.7 |
| 98 | Lidds | SE | -35.3 |
| 99 | Acticor Biotech | FR | -35.7 |
| 100 | Stayble Therapeutics | SE | -35.9 |
| 101 | Cassiopea | IT | -36.3 |
| 102 | Oasmia Pharma. | SE | -36.3 |
| 103 | Onxeo | FR | -36.6 |
| 104 | NFL Biosciences | FR | -36.8 |
| 105 | BergenBio | NO | -37.0 |
| 106 | Elicera Therapeutics | SE | -37.3 |
| 107 | Sprint Bioscience | SE | -37.6 |
| 108 | Galapagos | BE | -38.8 |
| 109 | AB Science | FR | -39.0 |
| 110 | Pharming Group | NL | -39.0 |
| 111 | Infant Bacterial Ther. | SE | -40.4 |
| 112 | Promore Pharma | SE | -40.5 |
| 113 | Modus Therapeutics | SE | -40.6 |
| 114 | Nicox | FR | -41.3 |
| 115 | Hybrigenics | FR | -41.3 |
| 116 | Lipum | SE | -41.8 |
| 117 | Lipigon Pharma. | SE | -42.0 |
| 118 | Immunicum | SE | -42.1 |
| 119 | Herantis Pharma | FI | -42.2 |
| 120 | Annexin Pharma. | SE | -43.5 |
| 121 | Biosergen | SE | -45.8 |
| 122 | Biophytis | FR | -46.3 |
| 123 | N4 Pharma | UK | -46.7 |
| 124 | Celyad | BE | -46.9 |
| 125 | Amniotics | SE | -47.0 |
| 126 | Nanobiotix | FR | -47.0 |
| 127 | Ascelia Pharma | SE | -47.1 |
| 128 | Addex Therapeutics | CH | -47.7 |
| 129 | Oxford Cannab. Tech. | UK | -49.0 |
| 130 | Paion | DE | -50.0 |
| 131 | PCI Biotech | NO | -50.1 |
| 132 | Evgen Pharma | UK | -50.2 |
| 133 | Immupharma | UK | -50.6 |
| 134 | Biofrontera | DE | -51.5 |
| 135 | Acacia Pharma | UK | -52.0 |
| 136 | Diamyd Medical | SE | -52.0 |
| 137 | Santhera Pharma. | CH | -52.5 |
| 138 | 4SC | DE | -53.5 |
| 139 | Vicore Pharma | SE | -55.8 |
| 140 | NextCell Pharma | SE | -56.3 |
| 141 | Idogen | SE | -56.7 |
| 142 | Saniona | DK | -57.0 |
| 143 | Noxxon Pharma | DE | -58.4 |
| 144 | 4D Pharma | UK | -58.4 |
| 145 | Cyxone | SE | -58.5 |
| 146 | Nuformix | UK | -60.2 |
| 147 | InDex Pharma | SE | -62.3 |
| 148 | Kancera | SE | -62.4 |
| 149 | Hansa Biopharma | SE | -63.1 |
| 150 | Morphosys | DE | -64.5 |
| 151 | QuiaPEG Pharma. | SE | -64.8 |
| 152 | Nanexa | SE | -66.2 |
| 153 | XSpray Pharma | SE | -67.0 |
| 154 | Isofol Medical | SE | -67.0 |
| 155 | Alligator Bioscience | SE | -67.7 |
| 156 | Asarina Pharma | SE | -67.9 |
| 157 | Cellectis | FR | -69.5 |
| 158 | Erytech Pharma | FR | -70.2 |
| 159 | CytoTools | DE | -71.0 |
| 160 | Cantargia | SE | -71.2 |
| 161 | Theranexus | FR | -73.5 |
| 162 | Bone Therapeutics | BE | -74.4 |
| 163 | Orphazyme | DK | -74.4 |
| 164 | Redwood Pharma | SE | -74.9 |
| 165 | Relief Ther. | CH | -76.9 |
| 166 | Targovax | NO | -77.2 |
| 167 | Polyphor | CH | -79.5 |
| 168 | Hemogenyx Pharma. | UK | -80.6 |
| 169 | Pharnext | FR | -94.5 |
| 170 | Oncopeptides | SE | -95.1 |
| 171 | Neovacs | FR | -98.3 |
| 172 | Motif Bio | UK | -100.0 |
| Country / Cluster | Avg Perf (%) | Median Perf (%) | Nb co. | YE'21 Total Mkt Cap (mEUR) |
|---|---|---|---|---|
| UK/IE | 3.7 | -2.6 | 28 | 7846.8 |
| FR | -10.8 | -22.0 | 35 | 7893.1 |
| BE/NL | -11.0 | -14.1 | 10 | 21461.1 (n=9) |
| NO/FI | -14.7 | -23.6 | 9 | 3461.5 |
| DE | -17.0 | -40.7 | 12 | 11809.0 (n=13) |
| EU (Global) | -18.7 | -28.5 | 172 | 93043.6 (n=171) |
| IT/ES | -23.7 | -22.8 | 6 | 3231.9 |
| DK | -24.0 | -34.2 | 7 | 26850.5 |
| CH | -28.4 | -25.0 | 10 | 4946.7 (n=9) |
| SE | -34.5 | -37.6 | 55 | 5542.9 |
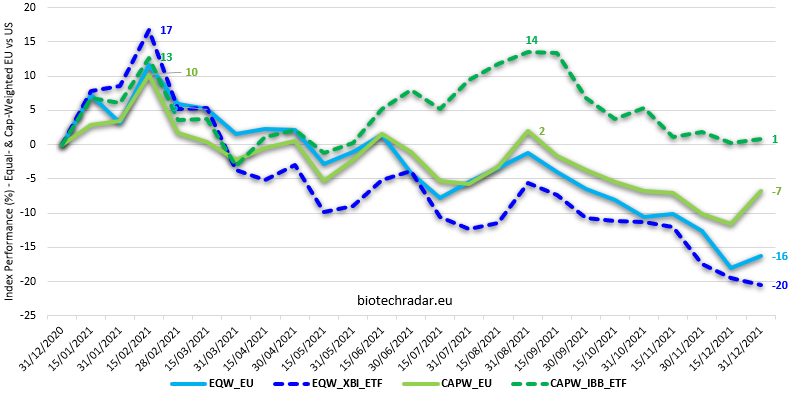
Once again, the UK/Ireland cluster was the best performing region in 2021 on the European markets (+3.7% average / -2.6% median last year versus +203.3% average / +54.5% median in 2020). 5 UK companies are in the Top 10 performances of the year (6 last year), and 9 are in the Top 20. Whereas the UK public bio landscape is mostly composed of small companies, the best UK performance in 2021 came from the largest player, i.e. Indivior, who lifted a huge legal overhang. They still have a large amount to pay though, but the future of the company is not in immediate jeopardy anymore. We will see the impact later. France and the Belgian/Dutch cluster managed to limit the damages, but overall, the falls were important everywhere. The decline was huge in Sweden (-34.5% on average, -37.6% median), with the local sentiment at it worse since a while, after a negative news flow overall. The best Swedish stock is only ranked 19th, meaning that even the stocks for those one may have expected a good performance, these were not able to outperform at the European level. One may finally note that the worst median performance was actually signed by Germany, with -40.7%. Indeed, 5 German bios declined by 50% or more in 2021, small or large. Overall, the stocks of the European public biotech companies (n=172) lost 18.7% on average (63% gain in 2020), with a median decline of 28.5% (14.8% median gain in 2020). Even though our universe is skewed towards nano-small caps, and is not really a like-for-like comparison with the XBI ETF, our market-cap equal-weighted European biotech index outperformed XBI (-16.2% vs -20.5% for XBI, also equal-weighted), whereas the market-cap-weighted IBB ETF outperformed our cap-weighted European biotech index (-0.6% for IBB vs -6.8% for our cap-weighted index - not like-for-like comparison either, but that’s all we have!). There was a transient positive effect ion IBB after the FDA approval of Aduhelm, but the negative momentum eventually came back in September. Overall, the performance of the European sector just mimicked the US sector in 2021. Given the increasing number of dual-listed companies (mostly among the largest ones, outside the special UK case), one may anticipate that the level of correlation between the US and the European markets increase progressively over time, at least for the cap-weighted indices.
Equal Weighted (EQW_EU vs XBI) vs Market Cap Weighted (CAPW vs IBB)
The total market cap of the European public biotech companies in our universe grew by 8.4% in 2021, to reach 93.0 bEUR (n=171), from 85.8 bEUR at the end of 2020, and 66.0 bEUR at the end of 2019. The 100 bEUR were reached early in September 2021, but they obviously did not hold.
To these numbers, we can also 32.2 bEUR of market cap for 39 European biotech companies only listed on Nasdaq. This excludes the 54.0 bEUR of BioNTech, who does not compete in the smidcap bios anymore. Overall, we can say that the European nano-to-smid bios are worth 125.2 bEUR, at the end of 2021. Or slightly more than a Sanofi (approximately 112 bEUR), and less than and AstraZeneca (approximately 160 bEUR, post Alexion acquisition).
Concerning the Pharma & large Diagnostics companies listed in Europe, our selected pool of 31 companies (market cap > 500 mEUR at the end of 2021, but including BioNTech) gained 23% on average (+7% in 2020 for 28 companies, +29% in 2019 for 32 companies) with a median gain of 16% (+1.5% in 2020, +25% in 2019). In 2021, the pandemic drove the Roche numbers up (+22.7%), where the large DX companies had mixed performances (-1.6% for Diasorin after +47% a year ago, +8% for for Biomerieux versus +45% in 2020, +15% for Qiagen versus +39% in 2020). For the European Big Pharma companies (Roche, Novartis, AstraZeneca, Novo Nordisk, Sanofi, GSK, BioNTech, Bayer), the mean performance was +44% in 2021 (-11% in 2020, +22% in 2019), whereas the median performance was +19% (-9% in 2020, +20% in 2019). BioNTech gained 216%, while Novo Nordisk outperformed for a second year in a raw with a gain of 72% (+10% in 2020, +30% in 2019), which makes the Danish company the 4th largest European Pharma listed on the European domestic markets. AstraZeneca (+18.5%) signed a strong year. Sanofi regained the grounds lost last year (+13% in 2021 after -12% in 2020). Same for GSK, who gained 20% in 2020 after -25% in 2020). Novartis underperformed again, with -4% in 2021 after -9% in 2020. Bayer loss 2.4% in 2021, after 34% in 2020 (extra issues, including from the crop division).
In out review last year, we had anticipated "a correction at some point, at least a technical one (the dreams of having a working drug for COVID-19 for all the companies involved will not last forever)". We indeed had that correction in 2021, which is sane, from a market perspective. It is also normal, at least technically, that the excess of early 2021 took some time to be corrected and digested. However, the length of the correction is seemingly unusually long. And the depth of the correction reached in January 2022 likely goes beyond what many had anticipated. Then it remains to be seen if a bottom was reached, or if the macro and geopolitical concerns will sweep away everything in its way, like a tornado. In this case, even a higher M&A activity may not be enough to sustain the valuations.
| Indices | Country | FY21 Perf (%) |
|---|---|---|
| Europe / Macro | ||
| CAC 40 | FR | 28.9 |
| BEL 20 | BE | 19 |
| AEX 25 | NL | 27.7 |
| DAX | DE | 15.8 |
| FTSE 100 | UK | 14.3 |
| EUROSTOXX 50 | EU | 21 |
| US / Macro | ||
| DJIA | US | 18.7 |
| S&P 500 | US | 26.9 |
| Nasdaq Comp. | US | 21.4 |
| Russell 2000 | US | 13.7 |
| Asia / Macro | ||
| NIKKEI 225 | JP | 4.9 |
| Shanghai Comp. | CN | 4.8 |
| Europe / Biotech | ||
| biotechradar.eu EQW | EU | -16.2 |
| biotechradar.eu CAPW | EU | -6.8 |
| US / Biopharma | ||
| Nasdaq Biotech - NBI | US | -0.3 |
| S&P Biotech ETF - XBI | US | -20.5 |
| iShares IBB ETF - IBB | US | -0.6 |
As mentioned earlier in this review, the performance of the main indices was very strong last year, making the poor performance of the biotech sector even worse, relatively. In Europe, the gains ranged from 14 to 29%. The US indices reached new all-time highs again. The investors in Asia were much less optimistic, ending with lower performances than in 2020! The declining growth in China is a concern. Evergrande also made the headlines in 2021, and not in a positive way.
At the end of 2021, the median market cap of the nano-smidcap European biotech companies in our universe dropped by 35% to 79.4 mEUR, from 122.4 mEUR at the end of 2020 (77.1 mEUR at the end of 2019, 70.0 mEUR at the end of 2018 (n=171 listed companies at the end of 2020, versus 150 at the end of the last 3 prior years). The euphoria didn’t hold. Moreover, most of the newly listed companies were small ones, impacting the median downwards. The European sector does need better companies, with a more attractive profile, but does it need more small, early-stage, and often one-trick-pony companies?