2.3 Assessing the full pipeline breadth: R&D programs in active clinical development
In this last part dedicated to the pipeline of the companies, we broaden the scope to all the indications addressed (only those in active development). We will define an “R&D program” as a unique combination of: a product candidate, a target indication (it can be a group of indications, e.g. Solid Tumors), a target population (e.g. pediatric / adult / elderly, a biomarker-based selected population, or a broader “all-comers”). The pivotal programs composed of 2 or more clinical trials are therefore counted only once. We also include the trial run by partners, as well as some Investigator-Initiated Studies (IIS), also called Investigator-Sponsored Trials (IST), but only if the trial is run in an indication that is not already studied by the companies or their partners. The products may also be approved in other indications. Finally, as described before, we assign a program to both companies when the ownership is shared through a licensing or a collaboration scheme, but it is consolidated at the country/cluster level again, in the case where both the licensing company and the licensee belong to the same country/cluster.
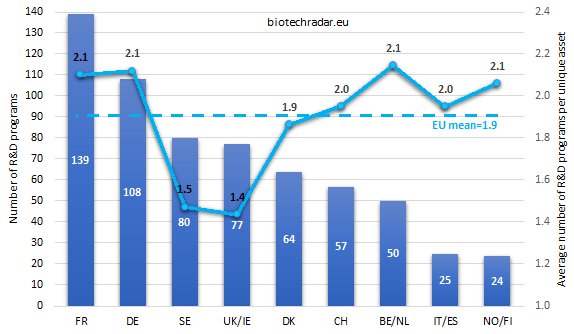
The distribution of the 624 R&D programs in active development is shown on Figure 16, for each country/cluster. The average number of R&D programs per unique asset is also provided. Looking at the absolute numbers, Germany shines by jumping from the fifth to the second position, as compared to Figure 9 (unique assets), owing this jump to the very broad -but mostly partnered- pipeline of Morphosys. Overall, the ranking is close to the one established for the unique assets. Sweden and UK/Ireland switch their positions, but the data are almost the same for both countries.
The picture changes a little bit when comparing how many R&D programs are derived per unique asset, on average (also Figure 16). With very few variations among the countries/clusters, one asset is actively developed simultaneously in 2 clinical programs, on average. This metric calls for additional insights though: the average number of R&D programs for a unique asset is actually driven by a small percentage of “pipeline-in-a-product” drugs. More concretely, 53 unique product candidates out the 341 unique product candidates (or 16%) were investigated in 3 or more programs, revealing the presence of 2 distinct populations of assets: those investigated 1 or 2 programs (average of 1.1 active R&D program/product candidate - 84% of the product candidates), and the so-called “pipeline-in-a-product” drugs (3 or more programs – 16% of the product candidates) found to be investigated in 5.8 active R&D programs, on average. Galapagos drives the numbers up for Belgium thanks to the large number of phase 2a of filgotinib. The average number of programs per asset is pumped up by phase 1 trials for Norway/Finland, thanks to BergenBio’s bemcentinib, investigated in several cancer types. Finally, the average number of phase 3 programs per asset is particularly high in Germany, thanks to Biofrontera’s Ameluz and guselkumab (Tremfya) from Morphosys/JNJ.
We will not show the figure similar to Figure 10, as the picture would typically be the same for the contributor’s balance for R&D programs, which makes sense. Though, in comparison, the contributions of Germany, France and Belgium/Netherlands grow up to 47.6% of the R&D programs versus 41.3% of the product candidates, thus compensating for share losses of Sweden and UK/Ireland (25.1% of the R&D programs versus 33.1% of the product candidates).
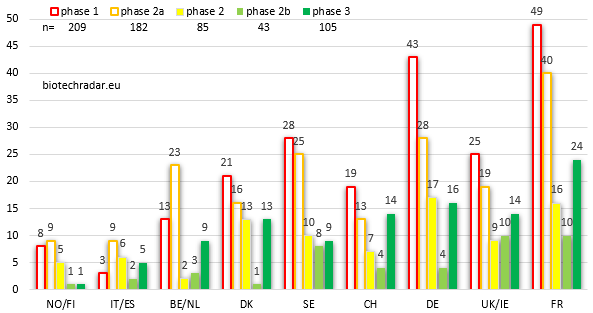
The 624 unique R&D programs are broken down by country/cluster and by development stage on Figure 17. We still represent the early-stage bars unfilled for an improved visualization of the data. Germany’s numbers are boosted in this ranking compared to Figure 11 (unique R&D assets). Indeed, Morphosys, the largest contributor in our universe with more than 60 unique programs in active development (alone and partnered), contributes a lot to this leapfrog (+3). On the contrary, Sweden and Belgium/Netherlands both go down by 2. For Sweden, this is explained by what we have described before, i.e. younger and less advanced companies, with narrower pipelines versus Germany and Switzerland. Concerning Belgium/Netherlands, the contribution of Galapagos does not manage to offset the effect of a lower number of companies in the cluster. Mid-stage-wise, Germany, France and Denmark are the top contributors, with a very large majority of programs in oncology. On the early-stage side, like for product candidates, France tops the ranking for R&D programs, with an even extended lead over the other 2 main countries/clusters (Sweden and UK/Ireland). Germany almost competes with France with twice as less companies, again mostly thanks to Morphosys, and to Evotec to a lesser extent. There were 105 unique phase 3 programs at the end of 2018.
The French biotech sector, ranks first or second at all development stages, reflecting both the ability of the French companies to deliver product candidates intended to be developed in several programs, in line with the standards (around 2 programs per candidate), which is less the case in the UK and Sweden. Germany shines in this ranking despite a lower number of companies, but this outperformance mainly lies into the contributions of 1 or 2 companies.
Finally, closing with the relative composition of the aggregated active R&D programs at country/cluster level (Figure 18), the first point is that the proportions at each stage are relatively similar to those reported for the unique assets (Figure 12). For the R&D programs from phase 1 to phase 3, the percentages are 31 / 31 / 15 / 7 / 17% on Figure 18, respectively. On Figure 12, these are 30 / 29 / 12 / 10 / 18% for the same stages. There is a slight decline overall at the late-stage, rounded to -5%, compensated by +2% at the mid-stage and +3% at the early-stage.
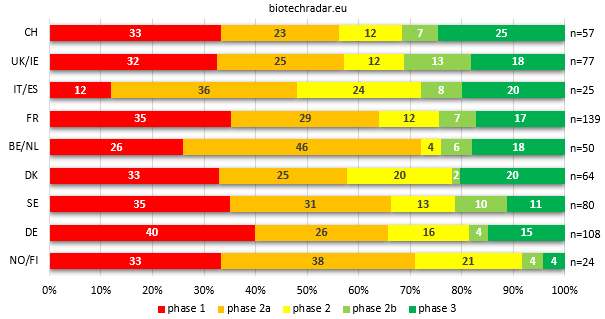
At another level, the variations by country can be quite important. For example, Belgium and Netherlands rank down by 3 versus Figure 12, because the high proportion of late-stage assets is finally diluted by the high number of early-stage programs (in particular by the phase 2a trials of filgotinib in several indications). The same applies for Norway/Finland (-1), where several phase 1 programs impacts the proportion of the late-stage programs. For the “Southern Europe” cluster (-2), the late-stage assets are also diluted, but by mid-stage programs (phase 2). Denmark (+1) is the only country with a significant increase of the proportion of late-stage programs, compared to the proportion of product candidates at the same stage. Germany (+1) and UK/Ireland (+2) are around neutral for their ratio of late-stage programs compared to the late-stage product candidates. Switzerland (+2), Sweden (-1) and France (+1) are both moderately diluted at the late stages. Switzerland takes a short lead on UK/Ireland, with the highest proportion of late-stage assets. Overall, the gap at the late stages between the different countries/clusters is narrowed. On Figure 12, the proportions of late-stage assets ranged between 18 and 43%, versus 19 and 32% on Figure 18 for the proportions of late-stage of R&D programs, discarding Norway/Finland’s massive dilution.
To conclude with the pipeline data, the absolute numbers indicate that France offers the largest potential of value creation, along with the UK/Ireland, as of 31/12/2018. Germany, with only half less companies, also has an attractive profile, with a deep pipeline, but dominated by one outlier. Switzerland and Denmark look alike in absolute, but the Swiss sector tops it in relative. Sweden is in-between these 2, due to a less mature landscape. Belgium/Netherlands do not seem especially great by the absolute numbers, but the comments at the end of the section 2.1 also apply here. Italia/Spain figures are low quantitatively, but are on the higher range qualitatively. Lastly, Norway/Finland, like Sweden, present a pretty early stage offer that asks to gain in maturity.