1.4 Development stages by country
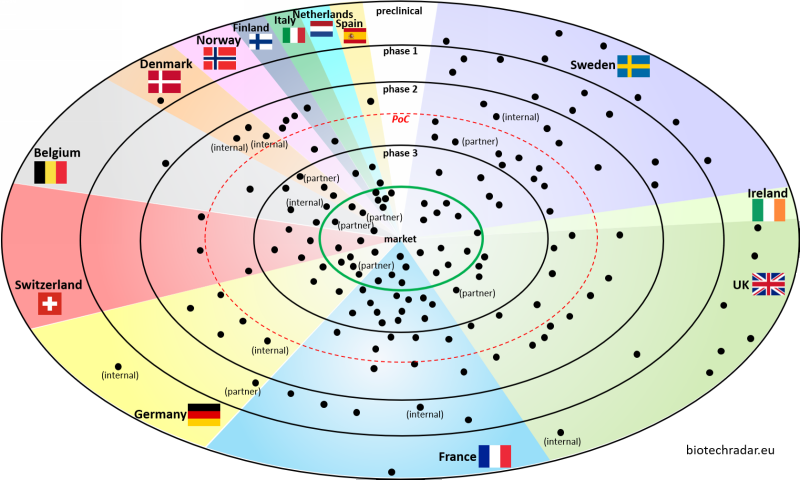
The radar plot in Figure 5 indicates the most advanced development stage of the companies, as of 31/12/2018. For a few cases, we separated the partnered pipeline from the internal developments, thus the mentions “partner” and “internal” associated with some dots (1 dot = 1 company, but 2 dots for each company with split internal/partnered contributions).
The 3 most represented countries, Sweden, UK, France, are also the main contributors of early stage companies, gathering 88% of the companies at preclinical/phase 1 stages. Of note, our definition of “early stage” is “having just reached the proof of concept or before”, as delimited by the red dotted circle. In our view, the Proof-of-Concept (PoC) might be more relevant, as the “phase 2” term might be too vague, without the purpose associated with the “phase 2”. It is not rare to see reports classifying a company that has just started a small phase 2a trial on 30 patients, and another company that has completed a dose-ranging phase 2b on 300 patients, at the same stage, i.e. “phase 2”. The difference between these 2 cases can be important, all other things being equal. So, it is worth seeing if companies are inside or outside the red circle. As always, there are particular cases, e.g. a PoC may be considered as established in a phase 1b or a phase 1[b]/2[a] in oncology, as usually labelled. Also, one could argue on what actually defines a “proof-of-concept”, but we will not go further in this introductory review.
Overall, the number of companies that made it to the finish line, with at least one product generating revenues, via direct sales or royalty streams is approximately 1 company out of 5 in our selection (32/150), as shown on Figure 6. The question of whether the marketed products generates strong revenues is another story. 38% of the biotech companies in our selection can be considered as “late-stage” companies, and 27% “early-stage” ones. 4% can be considered “mid-stage” companies (not early- nor late-stage), while 1 company out of 10 is still at preclinical stage.
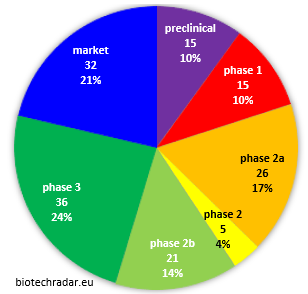
Fig. 6. Distribution of the European public biotech companies by development stage (most advanced project, partnered or internal - our universe)
Of note, the “phase 1” stage is really a transient stage when put into perspective of the time scale of clinical development, as this is typically the shortest step of all, when everything goes smoothly. Consequently, the proportion of companies in phase 1 should never be really important. Nevertheless, in oncology notably, the phase 1 stage may represent a significant proportion of the global clinical development time (case of 5/15 companies at phase 1 stage in Figure 7). Lastly, some companies run both a phase 1a trial in healthy volunteers and a phase 1b in patients to characterize the PK/PD of their investigational drugs more extensively, before moving into phase 2a typically. This is why some “phase 1” stage can last a year or so. This phase 1b step can also be part of a phase 1(b)/2(a). In this case the company stage is classified as phase 2a.
Lastly, some companies may run a pivotal program as soon as phase 2, so before the phase 3 stage (e.g. in oncology and rare/orphan deadly diseases).
The breakdown of companies by country and by development stage is provided on Figure 7. We will review more detailed product portfolio and R&D pipeline data in the next sections.
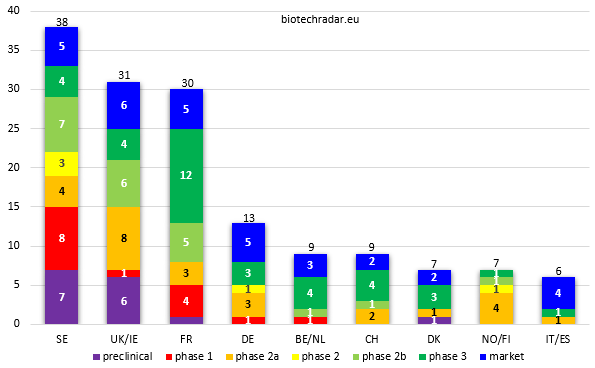
Fig. 7. European public biotech companies by development stage & by country (countries clustered to achieve a minimal number of companies) - highest combined total of late-stage (at least with a phase 2b running) & commercial-stage companies on the left
Finally, looking at the country level (or country clusters that make sense, notably based on geography/similarities), we rendered on Figure 8 the level of maturity of the respective national biotech sectors, at the end of 2018. Sticking to our early/late-stage definitions, the Belgian/Dutch public sector (n=9 companies) proposes the most mature panel in Europe, along with Switzerland (n=9). Indeed, these 2 clusters look very similar on this chart. The Italy/Spain cluster (“Southern Europe”) is the subgroup with the highest proportion of commercial stage companies (but n=7 only). Denmark, another small subgroup (n=7) is also well ranked. From the 3 large subgroups (Sweden n=38, UK/Ireland n=31, France n=30), the French sector displays the most advanced companies, proportionally. Sweden is the less mature subgroup in Europe, along with the other Nordic countries, as also depicted on Figure 5 (radar plot). Especially, when looking at the proportion of companies in phase 3 or higher, we can see there is a gap between the bottom 3 and the rest. Finally, Germany (n=13), displays a good balance, with the second proportion of companies having reached the market.
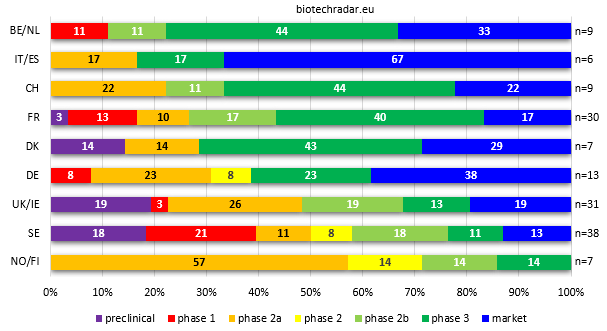
Fig. 8. Distribution (%) of European listed biotech companies by development stage (most advanced program) & by country/cluster - highest combined total of late-stage (at least with a phase 2b running) & commercial-stage companies on top
One should keep in mind there are some important limitations with this representation, especially when it comes to link these data with valuations. First, the most advanced program is not always a good reflect of the richness of a pipeline, both in terms of quantity and quality (e.g. programs more likely to reach the market even if less advanced). Also, it does not indicate anything on the asset NPVs (Net Present Values) in the portfolios. In addition, important distortions may occur with respect to the therapeutic areas. For example, an oncology company in phase 1b already having convincing data may easily have a valuation that is several folds higher than the valuation of a company in phase 2b in a niche indication. In conclusion, as many subgroups have a relatively small number of companies, such distortions may have a significant impact, on top of contributions from outliers.