
Two established players leaving breadcrumbs for the others
At the end of 2019, 2 companies had a market cap over 10 bEUR: Genmab, with 12.9 bEUR, mainly supported by growing DARZALEX sales, and Galapagos, with 12.1 bEUR, preparing to launch filgotinib with Gilead, who is now a long-term partner. 9 companies had a market cap over 1 bEUR, stable versus 2018. Hansa Biopharma, from Sweden, left the "Billion Euro Biotech Club", as the stock suffered in 2019 due a regulatory setback in the US for imlifidase (new trial required before filing). Zealand Pharma (Denmark) and Mithra Pharmaceuticals (Belgium) were the new entries. The Danish company almost completed the pivotal program of Dasiglucagon Hypopal, with a solo launch estimated early in 2021. More late-stage programs have also progressed at Zealand's, with in addition, a new deal with Alexion. Mithra, on their side, completed the pivotal program of ESTELLE (Estetrol E4 & Drospirenone combination) for the contraceptive market. Of note, Argenx's market cap almost doubled in 2019, from 3.1 to 6.1 bEUR, without any important readout! The number of companies with 500 mEUR of market cap or more was also stable in 2019, with 20 entries versus 18 in 2018, within the same universe.
Stock performances: 2019 a bottom year for the sentiment on the sector?
Adding the 3 newly listed companies to the 150 from our European listed bio universe defined last year, the performance was +12.9% in 2019, on average, but the median was -8.1%, exhibiting a large spread in performance between outliers on the gainers' side, and the many heavy decliners across the board. In itself, it is not shocking to have opposite performances for the mean and the median, but the 21% absolute difference between both values shows how strong momentums can be extreme on both side, at the same time. One might have thought that after -17% on average and -29% for the median performance in 2018, the sector would have recovered more of the lost ground, but it was without counting on all the macro threats. As most of the time, selectivity was the way to go on the sector last year.
| Company | Country | FY Var% | |
|---|---|---|---|
| 1 | Silence Therapeutics | UK | 567.7 |
| 2 | Shield Therapeutics | UK | 496.7 |
| 3 | Faron Pharma. | FI | 361.3 |
| 4 | Nuformix | UK | 338.7 |
| 5 | Diamyd Medical | SE | 260.9 |
| 6 | PharmaMar | ES | 227.5 |
| 7 | ReNeuron | UK | 208.7 |
| 8 | PCI Biotech | NO | 191.6 |
| 9 | Zealand Pharma | DK | 185.7 |
| 10 | Poxel | FR | 139.7 |
| 11 | Galapagos | BE | 131.5 |
| 12 | Probiodrug | DE | 113.4 |
| 13 | Pharming Group | NL | 106.6 |
| 14 | Nuevolution | DK | 90.6 |
| 15 | ABIVAX | FR | 90.5 |
| 16 | Crossject | FR | 90.1 |
| 17 | DBV Technologies | FR | 86.1 |
| 18 | Idorsia | CH | 84.6 |
| 19 | Calliditas Ther. | SE | 72.0 |
| 20 | ArGEN-X | BE | 68.5 |
| 21 | Santhera Pharma. | CH | 68.2 |
| 22 | Orphazyme | DK | 67.0 |
| 23 | Acacia Pharma | UK | 64.8 |
| 24 | Cyxone | SE | 63.0 |
| 25 | CytoTools | DE | 58.2 |
| 26 | AB Science | FR | 55.0 |
| 27 | Realm Therapeutics | UK | 53.8 |
| 28 | Oncodesign | FR | 47.1 |
| 29 | Morphosys | DE | 42.6 |
| 30 | Cantargia | SE | 41.9 |
| 31 | Immunicum | SE | 41.4 |
| 32 | Herantis Pharma | FI | 40.9 |
| 33 | Genmab | DK | 38.8 |
| 34 | Redx Pharma | UK | 37.5 |
| 35 | Molmed | IT | 37.0 |
| 36 | Immupharma | UK | 36.2 |
| 37 | Bavarian Nordic | DK | 34.5 |
| 38 | Evotec | DE | 32.8 |
| 39 | Diurnal Group | UK | 32.7 |
| 40 | Vectura | UK | 32.4 |
| 41 | Mithra Pharma. | BE | 31.3 |
| 42 | PledPharma | SE | 31.1 |
| 43 | Okyo Pharma | UK | 30.8 |
| 44 | Oryzon Genomics | ES | 28.1 |
| 45 | Camurus | SE | 26.3 |
| 46 | Ultimovacs | NO | 25.4 |
| 47 | Targovax | NO | 25.3 |
| 48 | Hybrigenics | FR | 25.0 |
| 49 | Formycon | DE | 22.7 |
| 50 | Amryt Pharma | IE | 19.4 |
| 51 | XSpray | SE | 18.2 |
| 52 | Basilea Pharma. | CH | 17.3 |
| 53 | BioArtic | SE | 15.7 |
| 54 | Cassiopea | IT | 14.8 |
| 55 | Lysogene | FR | 13.8 |
| 56 | Newron Pharma. | IT | 13.2 |
| 57 | OSE Pharma | FR | 11.2 |
| 58 | GeNeuro | CH | 7.6 |
| 59 | Erytech Pharma | FR | 7.2 |
| 60 | Orexo | SE | 6.8 |
| 61 | Cellectis | FR | 4.0 |
| 62 | Lidds | SE | 3.6 |
| 63 | Annexin Pharma. | SE | 3.5 |
| 64 | MedinCell | FR | 3.5 |
| 65 | Summit Therapeutics | UK | 3.3 |
| 66 | Hemogenyx Pharma. | UK | 2.6 |
| 67 | Genfit | FR | 1.7 |
| 68 | 4D Pharma | UK | 1.1 |
| 69 | Infant Bacterial Ther. | SE | 1.1 |
| 70 | Asarina Pharma | SE | -2.0 |
| 71 | NeuroVive | SE | -2.9 |
| 72 | Oncopeptides | SE | -3.4 |
| 73 | A1M Pharma | SE | -3.7 |
| 74 | Ascelia | SE | -5.6 |
| 75 | Advicenne | FR | -7.4 |
| 76 | InDex Pharma | SE | -7.6 |
| 77 | Molecular Partners | CH | -8.1 |
| 78 | Vicore Pharma | SE | -8.1 |
| 79 | Biofrontera | DE | -8.2 |
| 80 | Oxford Biomedica | UK | -8.8 |
| 81 | BergenBio | NO | -8.8 |
| 82 | Paion | DE | -9.6 |
| 83 | Heidelberg Pharma | DE | -12.4 |
| 84 | Cosmo Pharma. | IT | -12.7 |
| 85 | Nicox | FR | -13.0 |
| 86 | Isofol Medical | SE | -15.5 |
| 87 | Sensorion | FR | -15.8 |
| 88 | Corline Biomedical | SE | -18.0 |
| 89 | Oxurion | BE | -18.5 |
| 90 | Bone Therapeutics | BE | -18.9 |
| 91 | Valneva | FR | -18.9 |
| 92 | Scancell | UK | -19.4 |
| 93 | Saniona | DK | -19.7 |
| 94 | Innate Pharma | FR | -19.9 |
| 95 | 4SC | DE | -24.4 |
| 96 | XBrane Biopharma | SE | -24.6 |
| 97 | Gensight Biologics | FR | -25.2 |
| 98 | Active Biotech | SE | -25.2 |
| 99 | Allergy Therapeutics | UK | -25.5 |
| 100 | Verona Pharma | UK | -27.1 |
| 101 | Addex Therapeutics | CH | -27.1 |
| 102 | Nanobiotix | FR | -28.9 |
| 103 | Xintela | SE | -30.4 |
| 104 | Abionyx | FR | -30.6 |
| 105 | Destiny Pharma | UK | -30.6 |
| 106 | Tiziana Life Sciences | UK | -33.1 |
| 107 | Karessa Pharma | SE | -33.2 |
| 108 | Sareum | UK | -33.3 |
| 109 | Inventiva | FR | -34.7 |
| 110 | Combigene | SE | -35.3 |
| 111 | Onxeo | FR | -35.6 |
| 112 | BioInvent Internat. | SE | -35.8 |
| 113 | Quantum Genomics | FR | -36.7 |
| 114 | Nordic Nanovector | NO | -37.8 |
| 115 | Adocia | FR | -40.1 |
| 116 | Sprint Bioscience | SE | -41.1 |
| 117 | co.don | DE | -41.2 |
| 118 | Celyad | BE | -41.5 |
| 119 | IRLAB Therapeutics | SE | -41.9 |
| 120 | Noxxon Pharma | DE | -43.1 |
| 121 | Transgene | FR | -43.2 |
| 122 | Avacta | UK | -43.5 |
| 123 | Medigene | DE | -45.8 |
| 124 | Pharnext | FR | -46.1 |
| 125 | Kancera | SE | -47.7 |
| 126 | Medivir | SE | -48.2 |
| 127 | Alzinova | SE | -49.4 |
| 128 | FIT Biotech | FI | -50.0 |
| 129 | Alzecure Pharma | SE | -50.5 |
| 130 | Alligator Bioscience | SE | -52.0 |
| 131 | Midatech Pharma | UK | -53.3 |
| 132 | Klaria Pharma | SE | -54.3 |
| 133 | Oasmia Pharma. | SE | -54.8 |
| 134 | Polyphor | CH | -55.7 |
| 135 | Synairgen | UK | -56.4 |
| 136 | Gabather | SE | -59.7 |
| 137 | Evgen Pharma | UK | -60.5 |
| 138 | Indivior | UK | -65.3 |
| 139 | Hansa Medical | SE | -69.7 |
| 140 | Neovacs | FR | -70.0 |
| 141 | N4 Pharma | UK | -70.1 |
| 142 | ObsEva SA | CH | -72.4 |
| 143 | Promore Pharma | SE | -72.6 |
| 144 | Oncology Venture | DK | -73.8 |
| 145 | Kiadis Pharma | NL | -73.9 |
| 146 | Genkyotex | CH | -78.4 |
| 147 | Mereo BioPharma | UK | -79.9 |
| 148 | ASIT biotech | BE | -81.0 |
| 149 | Theranexus | FR | -83.0 |
| 150 | ValiRx | UK | -85.4 |
| 151 | Biophytis | FR | -88.2 |
| 152 | Mologen | DE | -93.8 |
| 153 | Motif Bio | UK | -98.8 |
| Country / Cluster | Avg Perf (%) | Median Perf (%) | Mkt Cap (mEUR) | Nb of co. (Perf) |
|---|---|---|---|---|
| NO/FI | +68.5 | +25.4 | 1008 / n=7 | 8 |
| IT/ES | +51.3 | +21.4 | 2648 | 6 |
| DK | +46.2 | +38.8 | 15055 | 7 |
| UK/IE | +36.6 | -8.8 | 3275 | 31 |
| EU (Global) | +12.9 | -8.1 | 65963 / n=150 | 153 |
| BE/NL | +11.6 | -18.5 | 20561 | 9 |
| DE | -0.7 | -9.6 | 8623 | 13 |
| FR | -2.1 | -14.4 | 5301 | 30 |
| CH | -7.1 | -8.1 | 4956 | 9 |
| SE | -7.7 | -11.8 | 3840 / n=38 | 40 |
At the end of the year, the Norway/Finland cluster displayed a stunning +69% progression, but this was mainly driven by 2 companies (Faron & PCI Biotech). Then come the Italy/Spain cluster with +51%, thanks to PharmaMar, Denmark with +46% thanks to Zealand and Nuevolution acquisition, and the UK/Ireland cluster (+37%). This UK performance seems to be only a modest recovery from the 2018 debacle (-46%) that led, at least in part, to the fall of the Woodford funds. The performance of Belgium/Netherlands (+12%) came in line with the European performance, in contrast to the usual outperformance of this cluster over the recent years. The rest of the field underperformed, and notably Sweden (-8%) and Switzerland (-7%). France (-2%) and Germany (-0.7%) ended almost on par with a year ago.
The spread between the median and mean performances within each cluster underlines the impact of outliers on the gaining side again, for almost all the countries/clusters, except 3 small ones representing less than 14% of all the companies (TOP3 countries/clusters in the above table).
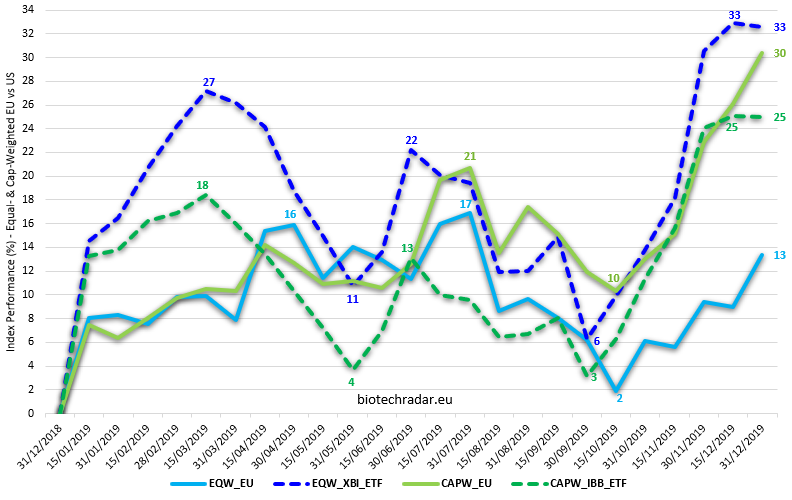
Equal Weighted (EQW_EU vs XBI) vs Market Cap Weighted (CAPW vs IBB)
In the US, the 2019 performance of the XBI ETF reached a healthy +33%, versus +25% for the IBB, reflecting an outperformance of the smallest caps versus the largest ones (equal weighting versus cap weighting), supported by a sustained M&A activity. This was the contrary for the European bios, a younger ecosystem with a shallower offer. Our Cap-Weighted synthetic index (n=150 companies) had a +30% progression in 2019, while our Equal-Weighted index (same set of companies) displayed only +13% for last year. This represents a large absolute difference of +17%, resonating the superb performances of Galapagos (+132%), argenx (+69%), Morphosys (+43%), Genmab (+39%), and Evotec (+33%), all weighting for roughly 50% of the total market cap of our European biotech universe at the end of 2018 (approx. 59% at the end of 2019). At least, one can say that the European leading biotech companies played in the same court as their US peers in 2019.
Concerning the Pharma & large Diagnostics companies listed in Europe, our selected pool of 32 companies (market cap > 500 mEUR at the end of 2019) gained 29%, on average, with a median gain of 25% in 2019. Once again, these data are more or less in line with the overall market, in terms of performance. For the European Big Pharma companies (Novartis, Roche, Sanofi, AstraZeneca, GSK, Novo Nordisk, Bayer), the performance was +22%, on average, and +20% for the median performance. Novo gained 29.8%, AstraZeneca 29.5% and Roche 29%. Novartis underperformed with only a 9.4% gain. Sanofi, with a new CEO and strategy, gained 19%. Similar gain for GSK (+19%).
The Swiss Vifor gained 65%, while the diagnostics company DiaSorin (Italy) gained 64%. The only strong decline came from IPSEN (France), with -30%, as the successor of SOMATULINE, palovarotene, acquired for 1.3 bUSD just at the beginning of 2019, was hit by a clinical hold in FOP at the end of the year. As it was not enough, the CEO David Meeks also left the company.
For the smaller pharma companies, Dermapharm gained 75%, Alk Abello 70%, and Spanish Faes Farma 68%.
At the end of the year, Asahi Kasei proposed a tender offer on Veloxis (+174%) for 1.4 bEUR.
The merger between Shire and Takeda was completed during the year. STADA and Stallergenes both went private.
So, according to our European biotech index, 2018 was technically the bottom for performances. But the 2019 data show a mixed trend. If not on performances, the question whether 2019 was a bottom for the sentiment on the European biotech sector might still be asked, also correlating this to the difficulties of most of the companies to finance their activities in decent conditions. Indeed, with an almost neutral performance in the middle of October, and whereas the average performance had been positive all year long, this question seems legitimate.
As we will see in the last section of this post, in the outlook for 2020, there might be reasons to believe it was the case. With many caveats, as usual.
Finally, the gap between the Cap Weighted and Equal Weighted indices in Europe indicates that the largest companies (more mature) usually perform better because of their track record, and more de-risked profile with respect to the smallest caps. This has been the case for the past 3 years in Europe, even in 2018. In 2016, the risks were more systemic (threats of drug pricing regulations during the presidential election campaign), thus even the largest European bios suffered this year, and underperformed. In the US, this is another story. On the recent past, this has even been the contrary, notably thanks to M&As. Lastly, the ranges of the market cap distributions are very different between Europe and the US (see our Introductory Report), so a small cap or a large cap biotech does not really have the same meaning in both territories.
| Indices | Country | FY Perf. (%) |
|---|---|---|
| Europe / Macro | ||
| CAC 40 | FR | +26.4 |
| BEL 20 | BE | +22.0 |
| AEX 25 | NL | +23.9 |
| DAX | DE | +25.5 |
| FTSE 100 | UK | +12.1 |
| EUROSTOXX 50 | EU | +24.8 |
| US / Macro | ||
| DJIA | US | +21.8 |
| S&P 500 | US | +28.4 |
| Nasdaq Comp. | US | +34.9 |
| Asia / Macro | ||
| NIKKEI 225 | JP | +18.2 |
| Shanghai Comp. | CN | +22.3 |
| Europe / Biotech | ||
| biotechradar.eu EQW | EU | +13.4 |
| biotechradar.eu CAPW | EU | +30.4 |
| US / Biotech-Biopharma | ||
| Nasdaq Biotech. - NBI | US | +24.4 |
| S&P Biotech ETF - XBI | US | +33.0 |
| iShares IBB ETF - IBB | US | +24.9 |
Conversely to 2018, 2019 was a global positive for all the markets in the world, thanks to a macro relief concerning the trade war between the US and China, and favorable policies from the Fed and the ECB. The performances of the main indices, in all the places, were relatively homogeneous. In Europe, the main indices progressed approximately by 25%, except for the UK with only +12% for the FTSE 100, as the Brexit is looming. The French CAC 40 is at its highest levels of more than a decade, the German DAX is close to its 2018 record levels. In the US, the main indices gained between 20 and 35%, with new all-time highs for all the indices. The Asian markets grew more moderately, with +18% in Japan and +22% in China. Overall, the performance of the US biotech sector was in line with the main indices in 2019. In Europe, this was also the case for the largest biotech companies, but the small caps underperformed by a margin, even by comparing with European microcap or nanocap ETFs. So that the sector cannot claim victory for 2019, in terms of outperformance.
Thanks to the equity financing operations offsetting the stock performances positively, the median market cap was 77.1 mEUR as of 31/12/2019, in progression from 70.0 mEUR as of 31/12/2018 (n=150 listed companies at the end of 2019, same number at the end of 2018). But let's face it, this number is still very low.